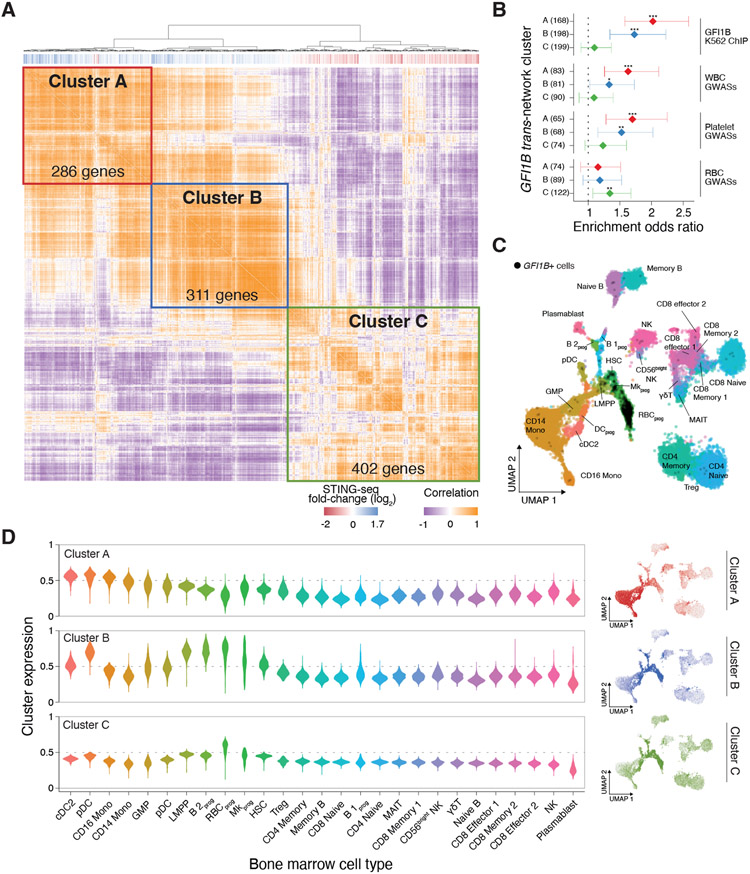
Figure 5. Subnetworks of GFI1B target genes are expressed in specific hematopoietic progenitors and differentiated cells.
(A) Co-expression matrix of rs524137-CRE GFI1B network genes in K562 with hierarchical clustering. Three clusters (A, B, and C) are indicated. The vertical bars below the dendrogram indicate if genes had increased (blue) or decreased (red) expression upon inhibiting the GFI1B CRE. (B) For each trans-regulatory GFI1B subnetwork (cluster), gene set enrichment odds ratios (diamonds) and 95% confidence intervals (lines) of closest genes to (top) GFI1B K562 ChIP-seq peaks and (bottom) fine-mapped variants from WBC, platelet, and RBC GWASs from 29 UK Biobank blood traits and 15 Blood Cell Consortium blood traits. Asterisks denote logistic regression p-values (* p < 0.05, ** p < 0.01, *** p < 0.001). (C) Uniform Manifold Approximation and Projection (UMAP) of human bone marrow cell gene expression from 35 Human Cell Atlas donors. Labels and colors indicate cell types (B 2prog: progenitor B-2 cells; RBCprog: red blood cell progenitors; DCprog: dendritic cell progenitors; full list in Table S4D). The black dots denote cells expressing GFI1B. GFI1B is most highly expressed in RBC progenitors, megakaryocyte progenitors, and hematopoietic stem cells. (D) Expression of genes from Clusters A, B, and C in each human bone marrow cell type (left) and in each cell in the UMAP space from panel C (right).

