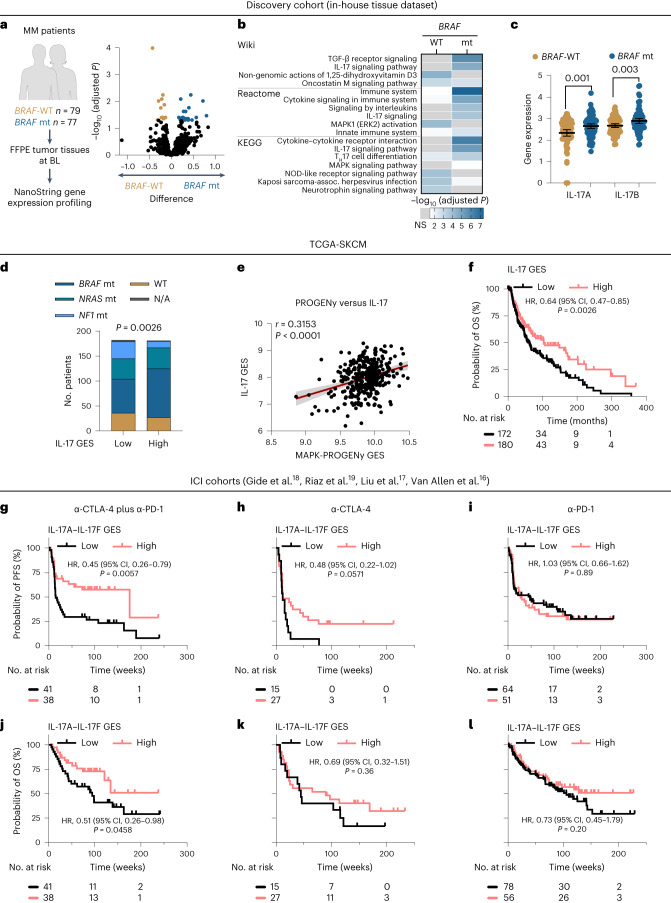
Fig. 1. IL-17 pathway genes are associated with improved response to dual ICI.
a, Left, schematic representation of the discovery cohort. Right, volcano plot showing the difference in BRAF-WT (n = 79 V600-negative samples)- and BRAF-mutant (n = 77 V600-positive samples)-associated gene expression (log2 (values)) and q values (−log10 (adjusted P values) from multiple unpaired t-tests with Benjamini, Krieger and Yekutieli test correction) in the discovery cohort. Each dot represents a gene; significant differentially expressed genes (q < 0.05) are shown in a color-coded manner. b, Heatmap showing enrichment scores (−log10 (adjusted P values), Benjamini–Hochberg-corrected FDR) of functional pathways in Wiki, Reactome and KEGG pathway databases. c, Scatter dot plots showing gene expression of IL17A and IL17B (n = 79 BRAF-WT, n = 77 BRAF-mutant tumors). Dots represent biologically independent patient samples. Mean ± 95% CIs are plotted; P values are from the unpaired t-test. d, Stacked bar plot showing the number of patients according to IL-17 signaling GES (according to KEGG hsa04657; cut point at median) and mutational subgroups in the TCGA-SKCM cohort (n = 363 tumor tissues). The P value is from the χ2 test. e, Scatterplot showing the correlation between IL-17 and the PROGENy MAPK activation GES in the TCGA-SKCM cohort (n = 363 tumor tissues). The line is from linear regression ±95% CI bands. f, Kaplan–Meier plot for OS according to the IL-17 signaling GES (KEGG hsa04657) in the TCGA-SKCM cohort. g–l, Kaplan–Meier plots for PFS (g–i) and OS (j–l) according to the IL-17 family GES (‘IL-17A–IL-17F GES’, IL-17 family cytokines containing the six structurally related cytokines) in patients treated with dual-ICI (g,j), mono anti-CTLA-4 (h,k) and mono anti-PD-1 (i,l) therapy. g–l, HR and 95% CIs are reported for high-expression groups. P values were calculated with the log-rank test. Categorization into ‘high’ versus ‘low’ was done according to an optimal cut point. All P values are two tailed. mt, mutant; FFPE, formalin fixed, paraffin embedded; BL, baseline; NS, not significant; NOD, nucleotide-binding oligomerization domain; assoc., associated; α, anti; N/A, not available.

