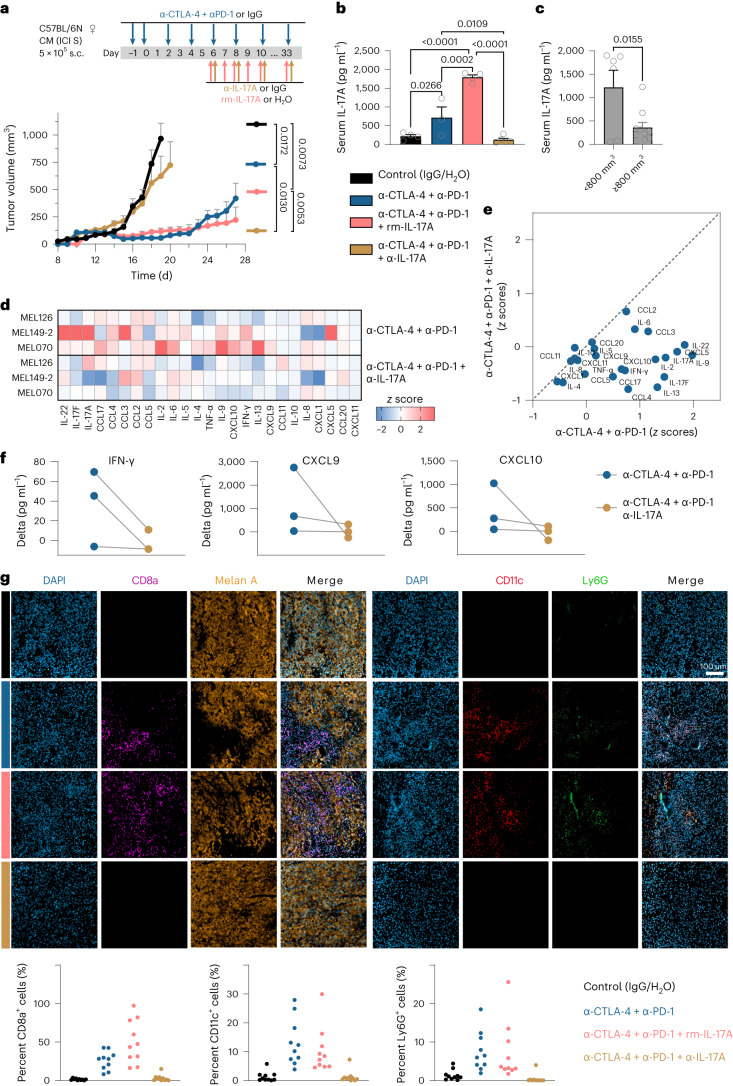
Fig. 2. IL-17A supports anti-tumor effects of dual ICI.
a, Tumor growth kinetics of transplanted CM (BRAF-WT ICI-sensitive) melanoma tumors treated with immunoglobulin G (IgG) or H2O (control, n = 6), anti-CTLA-4 + anti-PD-1 (n = 6), anti-CTLA-4 + anti-PD-1 + rm-IL-17A (n = 6) and anti-CTLA-4 + anti-PD-1 + α-IL-17A (n = 6) antibodies according to the depicted treatment schedule. Data points show mean + s.e.m. until the day when the first mice were eliminated from each group; P values are from one-way ANOVA with Tukey’s multiple-comparison test. b, Serum IL-17A levels from the endpoint measurement (day 33) by ELISA. Shown are mean + s.e.m. of n = 3–5 biologically independent samples per group; P values are from one-way ANOVA with Holm–Sidak’s multiple-comparison test. c, Corresponding serum IL-17A levels in mice grouped according to final tumor volume (n = 6 (<800 mm3) versus n = 10 (≥800 mm3) biologically independent samples). The bar plot shows mean + s.e.m., and the P value is from an unpaired t-test. d,e, Heatmap (d) and corresponding x–y plot (e) with z scores representing the normalized delta (stimulated − unstimulated condition) values of soluble mediators secreted by PDTFs from n = 3 human melanoma tumors treated ex vivo with anti-CTLA-4 + anti-PD-1 or with anti-CTLA-4 + anti-PD-1 + α-IL-17A antibodies. f, Delta values of IFN-γ, CXCL10 and CXCL9 secreted by PDTFs upon either anti-CTLA-4 + anti-PD-1 or anti-CTLA-4 + anti-PD-1 + α-IL-17A ex vivo treatment. g, Representative immunostaining images of CM tumors (day 9) showing melanoma (melan A) and immune cell markers (CD8a, CD11c, Ly6G). Scatter dot plots show the relative contribution of immune cells (n = 5 random fields per whole-tumor area, normalized to 4,6-diamidino-2-phenylindole (DAPI) values; n = 2 biologically independent tumors per group). All P values are two tailed. S, sensitive; s.c., subcutaneous; ♀, female; MEL, melanoma; CCL, C–C motif chemokine ligand; TNF, tumor necrosis factor.

