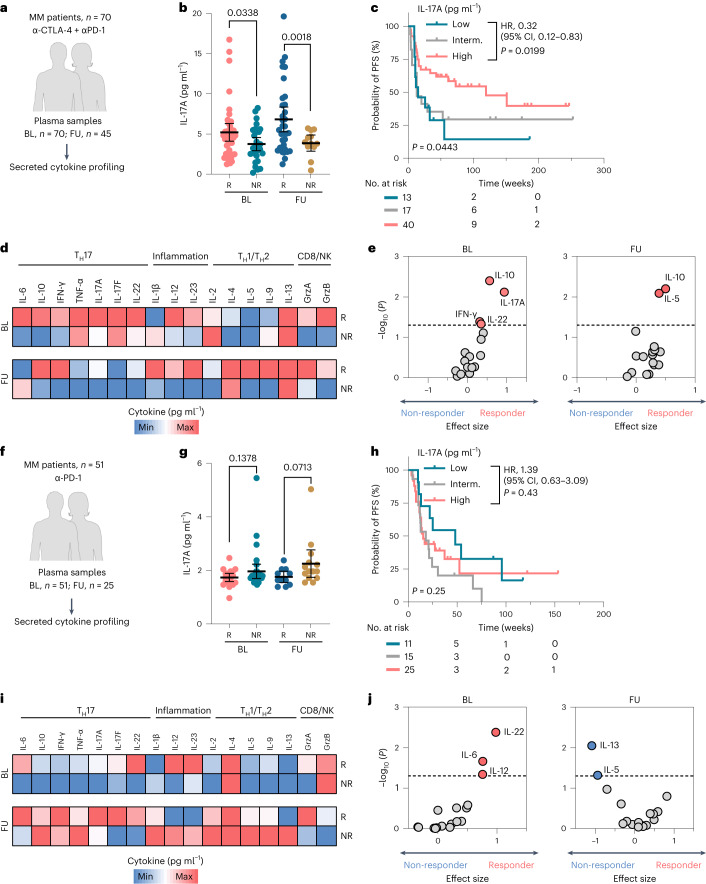
Fig. 5. IL-17A–TH17 profiling for response prediction in ICI-treated patients with melanoma.
a, Dual-ICI-treated melanoma patient cohort (first-line anti-CTLA-4 and anti-PD-1 therapy, n = 70). b, Plasma IL-17A levels as measured by ELISA in correlation to the best clinical response in samples collected at therapy baseline (n = 41 responders versus n = 29 non-responders) and at early follow-up (n = 33 responders versus n = 12 non-responders) visits. c, Kaplan–Meier plot for PFS according to the baseline IL-17A concentration. d, Heatmaps representing the median cytokine concentrations as quantified by multiplex cytokine array for responding versus non-responding patients. e, Corresponding volcano plot showing the effect size (Hedge’s g) and −log10 (P values) (Mann–Whitney U-test) for each cytokine for responding versus non-responding patients. f, Mono anti-PD-1-treated melanoma patient cohort (first-line anti-PD-1 therapy, n = 51). g, Plasma IL-17A levels as measured by ELISA in correlation to the best clinical response in samples collected at baseline (n = 19 responders versus n = 32 non-responders) and at early follow-up (n = 11 responders versus n = 14 non-responders) visits. h, Kaplan–Meier plot for PFS according to the baseline IL-17A concentration. i, Heatmaps representing median cytokine concentrations as quantified by multiplex cytokine array for responding versus non-responding patients. j, Corresponding volcano plot showing the effect size (Hedge’s g) and −log10 (P values) (Mann–Whitney U-test) for each cytokine for responding versus non-responding patients. P values are from the unpaired t-test with Welch’s correction, and mean ± 95% CIs are plotted in b,g. Each dot represents a biologically independent sample. Categorization into ‘high’ versus ‘low’ according to the X-tile-determined cut-point value was carried out separately within each dataset. HRs and 95% CIs are reported for ‘IL-17A high’, and P values are from the log-rank test in c,h. Significant predictors of response or non-response are shown above the dashed line (P < 0.05) in baseline or follow-up plasma samples in e,j. All P values are two tailed. FU, follow-up; responder, complete and partial responses; non-responder, progressive disease, mixed response; interm., intermediate.

