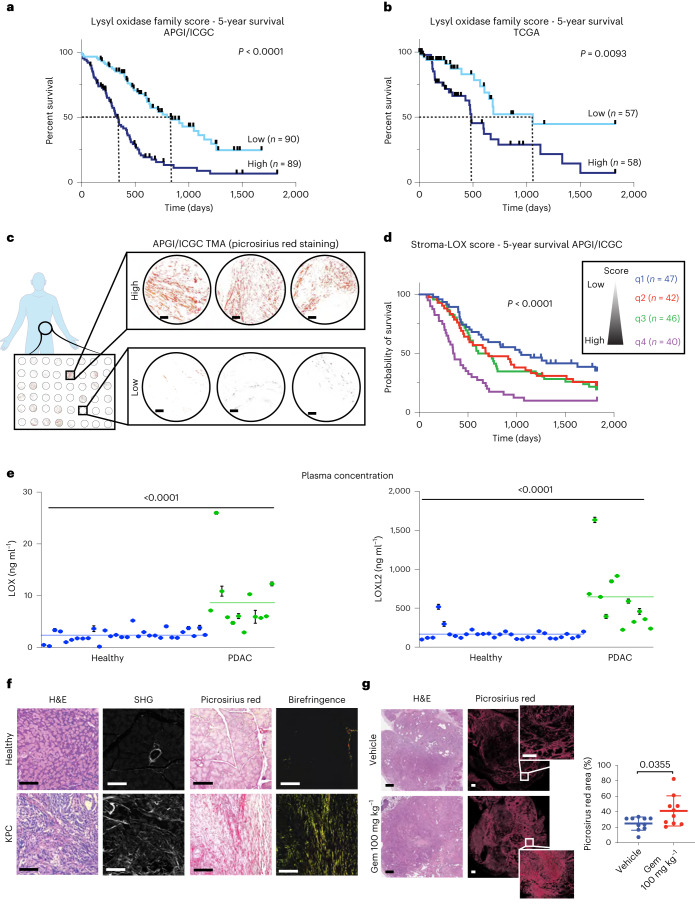
Fig. 1. Characterization of LOX family in PDAC.
a,b, Kaplan–Meier curves for 5-year overall survival for lysyl oxidase family scores in the APGI/ICGC (low, n = 90 patients; high, n = 89 patients) (a) and TCGA (low, n = 57 patients; high, n = 58 patients) (b) PDAC datasets. Lines represent upper and lower tertiles. The lysyl oxidase family expression score is weighted by the Cox proportional hazards model coefficients for each family member. P values determined by log-rank (Mantel–Cox) test. c, Representative images of picrosirius red stained tumor cores from APGI/ICGC tumor microarrays. Scale bar, 100 μm. d, Lysyl oxidase family score was integrated with the picrosirius red score to create a combined ‘stroma-lysyl oxidase family’ score (representing tumor fibrosis and lysyl oxidase family expression) and Kaplan–Meier curves for 5-year overall survival plotted. P value refers to q1 versus q4. P values determined by log-rank (Mantel–Cox) test. e, Human LOX and LOXL2 plasma concentrations in healthy (n = 30 patient samples) and patients with PDAC (n = 12 patient samples) determined by SiMoA. Data are presented as mean values and error bars represent %CV of three technical replicates from each patient. Two-tailed P value determined by unpaired, nonparametric t-test with a Mann–Whitney U-test correction (comparison between two groups). f, Representative images for comparison of age-matched healthy pancreas (taken from one of five biologically independent animals) and KPC PDAC tumor (taken from one of eighteen biologically independent animals) stained for H&E (left), imaged by multiphoton SHG imaging for collagen I (center left), picrosirius red staining viewed by transmitted light (center-right) and by polarized light (right). Scale bars, 100 μm. g, Quantitative comparison of picrosirius red staining in tumors from KPC tumor-bearing mice treated with either saline vehicle or gemcitabine (n = 10 biologically independent animals per group). Data presented as mean values ± s.d. Scale bars, 500 μm. Two-tailed P values determined by unpaired, nonparametric t-tests with a Mann–Whitney U-test correction (comparison between two groups).

