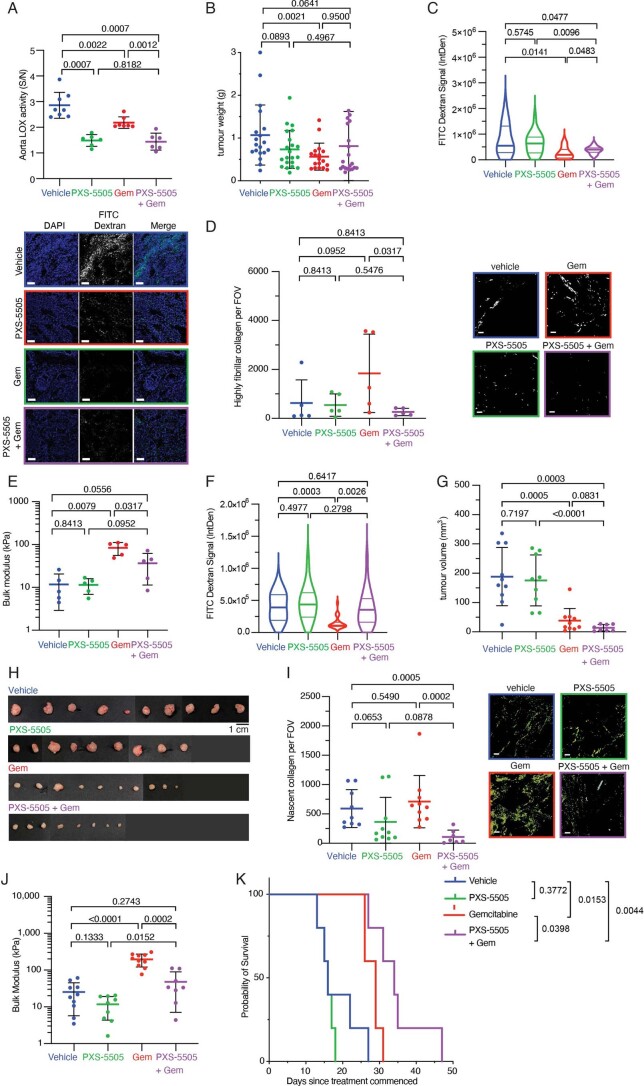
Extended Data Fig. 5. PXS-5505 in combination with gemcitabine in vivo.
a. Lysyl oxidase family activity measured in the aorta of KPC tumor bearing mice at end point, measured by fluorometric activity assay confirming lysyl oxidase family inhibition. Signal is defined as the enzyme activity in the aorta, while noise is measured in the presence of a high concentration (300 µM) BAPN to abolish any lysyl oxidase family activity. Signal over noise equal to 1 indicates complete inhibition. p-value determined by unpaired, nonparametric t-test with a Mann–Whitney U correction (comparison to vehicle control) (vehicle n = 8 biologically independent animals, Gem n = 7 biologically independent animals, PXS-5505 n = 6 biologically independent animals, PXS-5505 + Gem n = 6 biologically independent animals). Data presented as mean values +/− SD b. Tumor weight (grams) at end point from each treatment group (vehicle n = 19 biologically independent animals, Gem n = 18 biologically independent animals, PXS-5505 n = 21 biologically independent animals, PXS-5505 + Gem n = 21 biologically independent animals). p-value determined by unpaired, nonparametric t-test with a Mann–Whitney U correction (comparison between two groups). Data presented as mean values +/− SD. c. FITC-dextran (molecular weight: 10 kDa) signal quantification from KPC tumor end point from each treatment group (vehicle n = 3 biologically independent animals, PXS-5505 n = 5 biologically independent animals, Gem n = 5 biologically independent animals, PXS-5505 + Gem n = 5 biologically independent animals). 4 ROIs taken per mouse. P-values determined by Welchs t-test. Data presented as mean values +/− SD. Scale bars = 100 μm d. Quantification of red birefringent (mature) collagen fibers from human PDXs at end point after 3 cycles of treatment, treated as indicated. 5 fields of view (500 μm × 500 μm) per mouse. p-values determined by unpaired, nonparametric t-test with a Mann–Whitney U correction (vehicle n = 5 biologically independent animals, Gem n = 5 biologically independent animals, PXS-5505 n = 5 biologically independent animals, PXS-5505 + Gem n = 5 biologically independent animals). Data presented as mean values +/− SD. Scale bars = 100 μm e. Quantification of bulk modulus (stiffness) by unconfined compression testing of end point human PDX tumors from each treatment group (vehicle n = 5 biologically independent animals, Gem n = 5 biologically independent animals, PXS-5505 n = 5 biologically independent animals, PXS-5505 + Gem n = 5 biologically independent animals) [individual tumors shown]). Data presented as mean values +/− SD. p-value determined by unpaired, nonparametric t-test with a Mann–Whitney U correction (comparison between two groups) f. FITC-dextran (molecular weight 10 kDa) signal quantification from human PDXs from each treatment group (vehicle n = 4 biologically independent animals, PXS-5505 n = 5 biologically independent animals, Gem n = 5 biologically independent animals, PXS-5505 + Gem n = 5 biologically independent animals). 4 ROIs taken per mouse. P values determined by Welchs t-test. g. A second human PDX model at end point after 3 cycles of treatment. Tumor volumes (mm3) at end point from each treatment group (vehicle n = 9 biologically independent animals, Gem n = 10 biologically independent animals, PXS-5505 n = 10 biologically independent animals, PXS-5505 + Gem n = 7 biologically independent animals). p-value determined by unpaired, nonparametric t-test with a Mann–Whitney U correction (comparison between two groups). Data presented as mean values +/− SD. h. Image of human PDX tumors after 3 cycles of treatment i. Quantification of green birefringent (nascent) collagen fibers from human PDXs at end point, treated as indicated. 3 fields of view (750 μm × 750 μm) per mouse. p-values determined by unpaired, nonparametric t-test with a Mann–Whitney U correction (vehicle n = 10 biologically independent animals, Gem n = 10 biologically independent animals, PXS-5505 n = 9 biologically independent animals, PXS-5505 + Gem n = 7 biologically independent animals). Data presented as mean values +/− SD. Scale bars = 100 μm j. Quantification of bulk modulus (stiffness) by unconfined compression testing of end point human PDX tumors from each treatment group (vehicle n = 10 biologically independent animals, Gem n = 10 biologically independent animals, PXS-5505 n = 9 biologically independent animals, PXS-5505 + Gem n = 8 biologically independent animals) [individual tumors shown]). Data presented as mean values +/− SD. p-value determined by unpaired, nonparametric t-test with a Mann–Whitney U correction (comparison between two groups) k. Kaplan–Meier curves for overall survival across treatment arms (n = 5 (vehicle), n = 5 (Gem), n = 5 (PXS-5505), n = 5 (PXS-5505 + Gem). Treatment commenced once tumor reached 50 mm3 p-values determined by Log-rank (Mantel–Cox) test.

