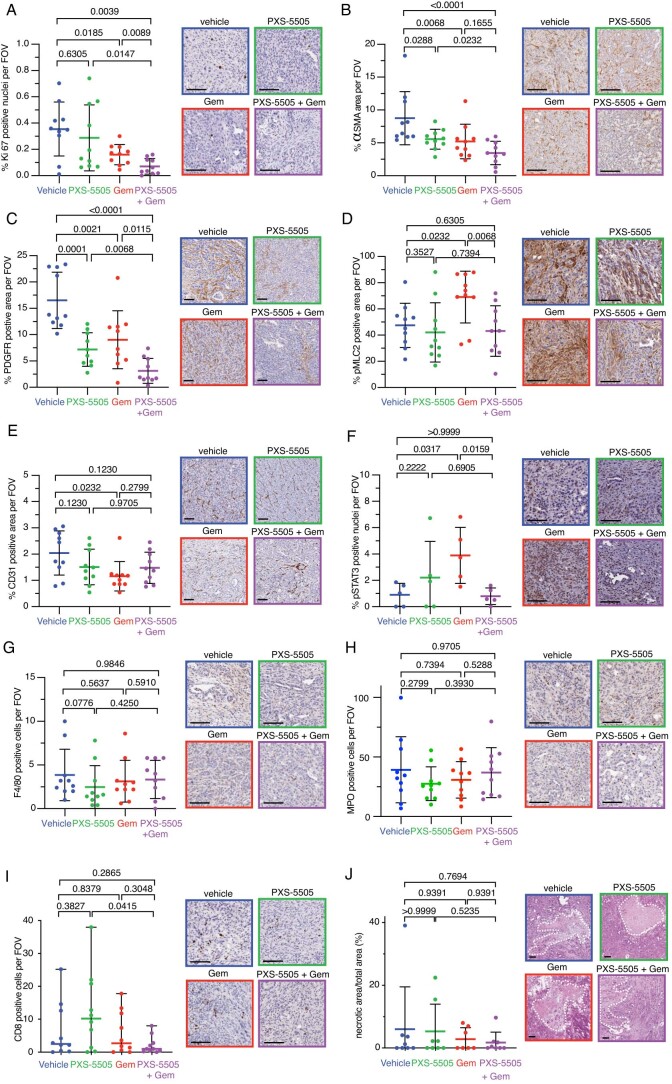
Extended Data Fig. 6. PXS-5505 in combination with gemcitabine in a KPC model.
a. Quantification of proliferating cells (Ki67 positive nuclear staining) in KPC tumors at end point, treated as indicated. 5 fields of view (500 μm × 500 μm) per mouse and 10 mice per cohort were scored. Data presented as mean values +/− SD. p-values determined by unpaired, nonparametric t-test with a Mann–Whitney U correction. Scale bars = 100 μm b. Quantification of percent coverage of αSMA positive staining in KPC tumors at end point, treated as indicated. 3 fields of view (1000 μm × 1000 μm) per mouse and 10 mice per cohort were scored. Data presented as mean values +/− SD. p-values determined by unpaired, nonparametric t-test with a Mann–Whitney U correction. Scale bars = 100 μm c. Quantification of percent coverage of PDGFR-ß positive staining in KPC tumors at end point, treated as indicated. 3 fields of view (1000 μm × 1000 μm) per mouse and 10 mice per cohort were scored. Data presented as mean values +/− SD. p-values determined by unpaired, nonparametric t-test with a Mann–Whitney U correction. Scale bars = 100 μm d. Quantification of pMLC2 positive staining in stromal regions of KPC tumors at end point, treated as indicated. 3 fields of view (500 μm × 500 μm) per mouse and 10 mice per cohort were scored. Data presented as mean values +/− SD. p-values determined by unpaired, nonparametric t-test with a Mann–Whitney U correction. Scale bars = 100 μm e. Quantification of tumor vasculature (CD31 positive staining) in KPC tumors at end point, treated as indicated. 3 fields of view (1000 μm × 1000 μm) per mouse and 10 mice per cohort were scored. Data presented as mean values +/− SD. p-values determined by unpaired, nonparametric t-test with a Mann–Whitney U correction. Scale bars = 100 μm f. Quantification of STAT3 activation (pSTAT3 positive nuclear staining) in KPC tumors at end point, treated as indicated. 3 fields of view (1000 μm × 1000 μm) per mouse and 5 mice per cohort were scored. Data presented as mean values +/− SD. p-values determined by unpaired, nonparametric t-test with a Mann–Whitney U correction. Scale bars = 100 μm. g Quantification of macrophage infiltration (F4/80 positive staining) in KPC tumors at end point, treated as indicated. 5 fields of view (500 μm × 500 μm) per mouse and 10 mice per cohort were scored. Data presented as mean values +/− SD. p-values determined by unpaired, nonparametric t-test with a Mann–Whitney U correction. Scale bars = 100 μm h. Quantification of number of myeloperoxidase (MPO+) cell infiltration in KPC tumors at end point, treated as indicated. 5 fields of view (500 μm × 500 μm) per mouse and 10 mice per cohort were scored. Data presented as mean values +/− SD. p-values determined by unpaired, nonparametric t-test with a Mann–Whitney U correction. Scale bars = 100 μm i. Quantification of T-cell infiltration (CD8 positive staining) in KPC tumors at end point, treated as indicated. 5 fields of view (500 μm × 500 μm) per mouse and 10 mice per cohort were scored. p-values determined by unpaired, nonparametric t-test with a Mann–Whitney U correction. Data presented as median values with range. Scale bars = 100 μm j. Quantification of necrosis determined by H&E in KPC tumors at end point, treated as indicated (vehicle n = 8 biologically independent animals, Gem n = 7 biologically independent animals, PXS-5505 n = 8 biologically independent animals, PXS-5505 + Gem n = 8 biologically independent animals). Data presented as mean values +/− SD. p-values determined by unpaired, nonparametric t-test with a Mann–Whitney U correction. Scale bars = 100 μm.

