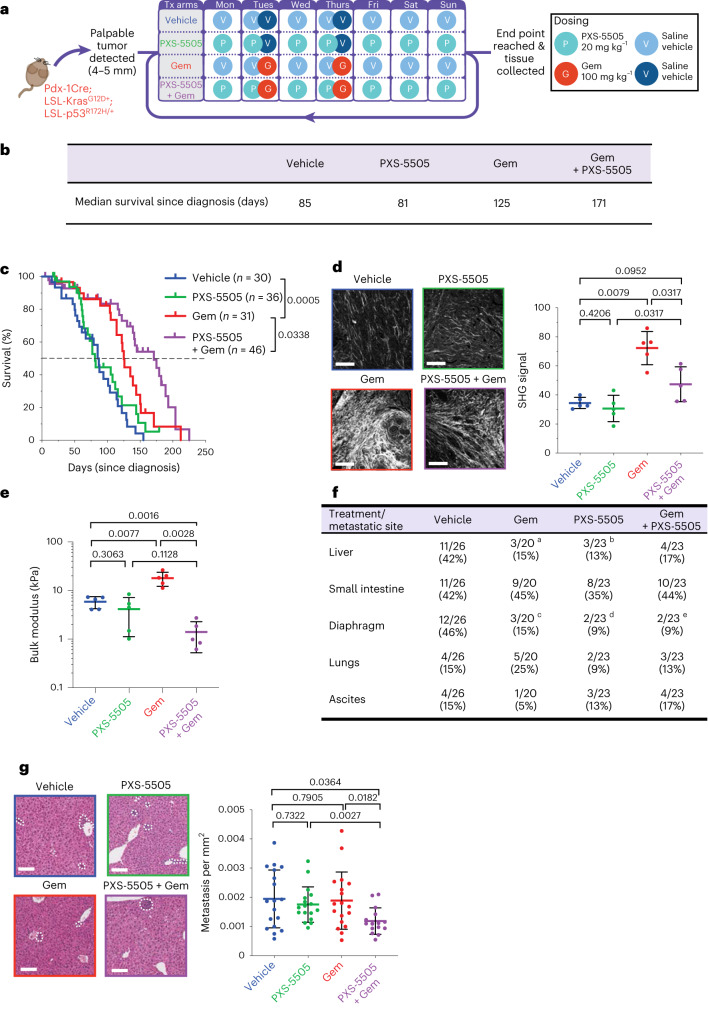
Fig. 4. PXS-5505 administered in a KPC in vivo survival study.
a, Schematic of the KPC in vivo survival study. Presence of a primary tumor in KPC mice was confirmed by two independent researchers (positive diagnosis) before commencement of daily treatment (Tx) on one of four treatment arms as follows: vehicle, 0.9% saline; Gem, twice-weekly gemcitabine (100 mg kg−1 i.p.); PXS-5505, daily PXS-5505 at 20 mg kg−1 i.p.; and PXS-5505 + Gem, daily PXS-5505 at 20 mg kg−1 i.p. + twice-weekly gemcitabine (100 mg kg−1 i.p.). b, Table of median survival (since diagnosis/commencement of treatment) across the four treatment groups (n = 30 biologically independent animals (vehicle), n = 31 biologically independent animals (Gem), n = 36 biologically independent animals (PXS-5505), n = 46 biologically independent animals (PXS-5505 + Gem)). c, Kaplan–Meier curves for overall survival across treatment arms (n = 30 biologically independent animals (vehicle), n = 31 biologically independent animals (Gem), n = 36 biologically independent animals (PXS-5505), n = 46 biologically independent animals (PXS-5505 + Gem)). P values determined by log-rank (Mantel–Cox) test. d, Representative maximum intensity projections of SHG multiphoton imaging for tumors from each treatment group (n = 1 FOV taken from one biologically independent animal per group) at end point (scale bars, 100 μm) and quantification of SHG peak signal intensity (n = 5 biologically independent animals per group and five FOV per animal). Data are mean ± s.d. Two-tailed P values determined by unpaired, nonparametric t-test with a Mann–Whitney U-test correction (comparison between two groups) e, Quantification of bulk modulus (stiffness) by unconfined compression testing of end-point PDAC tumors from each treatment group (n = 5 biologically independent animals per group; individual tumors shown), data are mean ± s.d. Two-tailed P value determined by unpaired, nonparametric t-test with a Mann–Whitney U-test correction (comparison between two groups). f, Presence of overt metastatic lesions observed during necropsy (number of mice). Two-tailed P values determined by chi-squared test. aLiver (vehicle versus Gem, P = 0.046, chi-squared); bLiver (vehicle versus PXS-5505, P = 0.023, chi-squared); cDiaphragm (vehicle versus Gem, P = 0.026, chi-squared); dDiaphragm (vehicle versus PXS-5505, P = 0.004, chi-squared); and eDiaphragm (vehicle versus Gem + PXS-5505, P = 0.004, chi-squared). g, Representative images of H&E-stained livers from each treatment group (n = 1 FOV taken from one biologically independent animal per group) (scale bars, 100 μm). Quantification of metastases (n = 18 biologically independent animals (vehicle), n = 18 biologically independent animals (Gem), n = 17 biologically independent animals (PXS-5505), n = 15 biologically independent animals (PXS-5505 + Gem)). Data are mean ± s.d. Two-tailed P values were determined by unpaired, nonparametric t-test with a Mann–Whitney U-test correction (comparison between two groups).

