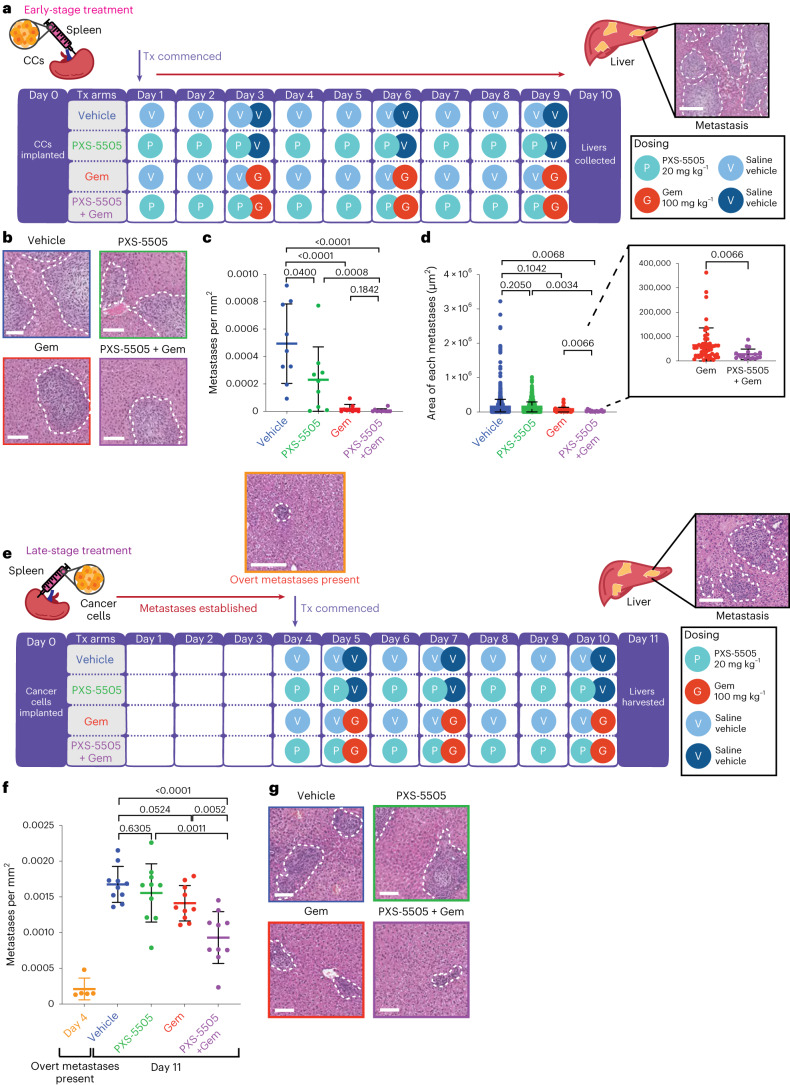
Fig. 5. PXS-5505 administered in intrasplenic models of liver colonization.
a, Schematic of the intrasplenic model of liver colonization with early administration of treatment. CCs were implanted into the spleen of BALB/c-Fox1nuAusb mice under anesthesia on day 0. Treatment with 0.9% saline (vehicle); twice-weekly Gem (100 mg kg−1 i.p.) (Gem); daily PXS-5505 at 20 mg kg−1 i.p. (PXS-5505) or daily PXS-5505 at 20 mg kg−1 i.p. + twice-weekly Gem at 100 mg kg−1 i.p. (PXS-5505 + Gem) was administered from day 1. At the end point (day 10) livers were collected and H&E-stained for scoring. Representative images of H&E-stained liver (taken from one biologically independent animal). Scale bar, 100 μm. b, Representative images of H&E-stained livers from each treatment group (n = 1 FOV taken from one biologically independent animal per group). Scale bars, 100 μm. c, Quantification of metastases per mm2 (n = 9 biologically independent animals per group). Data are mean ± s.d. Two-tailed P values were determined by unpaired, nonparametric t-test with a Mann–Whitney U-test correction (comparison between two groups). d, Quantification of the area of each metastasis in treatment groups (n = 9 biologically independent animals per group). Data are mean ± s.d. Two-tailed P values were determined by an unpaired, nonparametric t-test with a Mann–Whitney U-test correction (comparison between two groups). e, Schematic of intrasplenic model of liver colonization with late administration of treatment. CCs were implanted into the spleen of BALB/c-Fox1nuAusb mice under anesthesia on day 0. Treatment with 0.9% saline (vehicle); twice-weekly Gem (100 mg kg−1 i.p.) (Gem); daily PXS-5505 at 20 mg kg−1 i.p. (PXS-5505); or daily PXS-5505 at 20 mg kg−1 i.p. + three doses of Gem (100 mg kg−1 i.p. (PXS-5505 + Gem) was administered from day 4. Representative images of H&E-stained liver (taken from one biologically independent animal). Scale bar, 100 μm. f, Quantification of metastases at endpoint (n = 10 biologically independent animals per treatment group, n = 5 biologically independent animals at day 4 for confirmation of overt metastases). Data are mean ± s.d. P values were determined by an unpaired, nonparametric t-test with a Mann–Whitney U-test correction (comparison between two groups). g, Representative images of H&E-stained livers from each treatment group. Scale bars, 100 μm.

