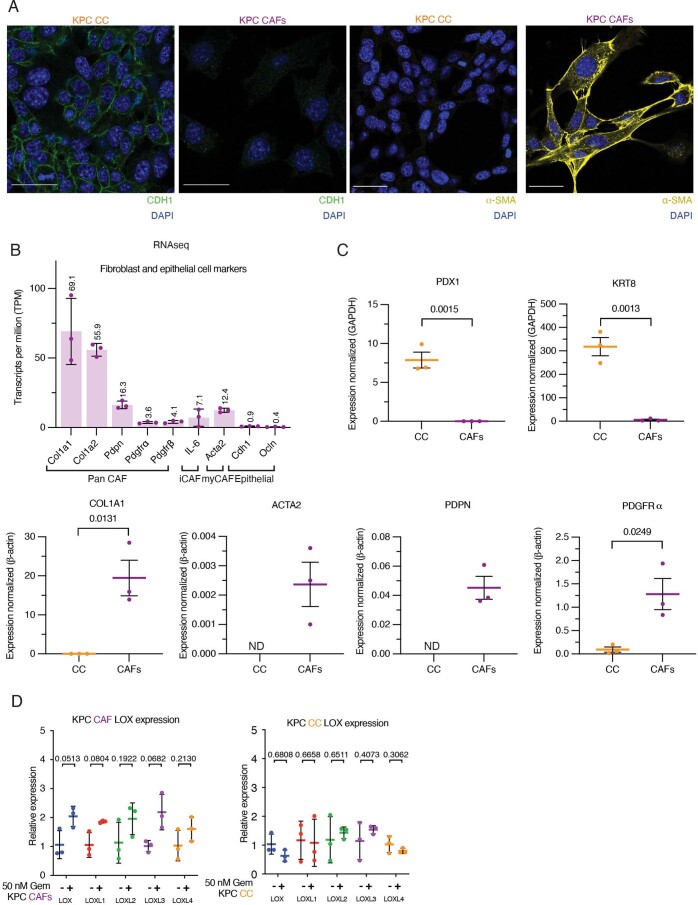
Extended Data Fig. 2. Characterization of cells derived from the KPC autochthonous model.
a. Immunofluorescence staining of KPC CCs and KPC CAFs for the pancreatic epithelial cell marker CDH1 (green), DAPI (blue) and for the CAF marker α-SMA (yellow), DAPI (blue). Representative images from n = 3 biological independent samples. Scale bar = 30 μm. b. RNAseq reads for CAF and epithelial cell makers in KPC CAFs n = 3 biological independent samples. Data presented as mean values +/− SD c. qRT-PCR of select pancreatic epithelial cell markers and CAF markers in KPC CCs and KPC CAFs, n = 3 biological repeats with 3 technical replicates per biological repeat. p value determined by unpaired, parametric t-test. Data is presented as mean values ± SEM. (ND = not detected) d. qRT-PCR for lysyl oxidase family members in KPC CAFs and KPC CCs treated with 50 nM gemcitabine or vehicle control for 48 hours, n = 3 biological repeats with 3 technical replicates per biological repeat. Data presented as mean values +/− SD. Relative fold expression of LOX family members from gemcitabine treated samples compared to control were determined by 2–∆∆Ct approach. p-values were determined by unpaired, nonparametric t-test with a Mann–Whitney U correction (comparison between two groups).

