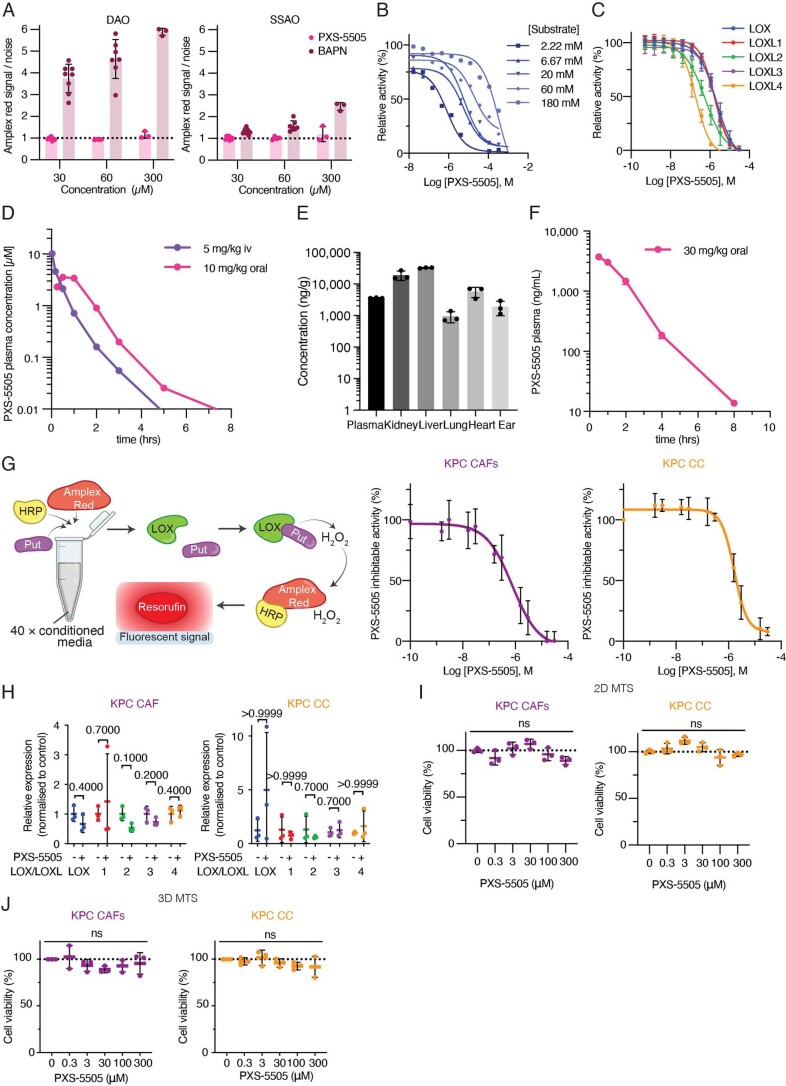
Extended Data Fig. 3. PXS-5505 is a LOX family specific inhibitor.
a. Turnover of ßAPN by DAO (n = 8 (30 μM), 7 (60 μM), 3 (300 μM) and SSAO (n = 9 (30 μM), 7 (60 μM), 3 (300 μM) as measured by H2O2 release using an amplex red coupled fluorometric activity assay. Data presented as mean values +/− SD b. Substrate competition assay whereby PXS-5505 concentrations versus putrescine dihydrochloride is performed in an amplex red assay using bovine aorta extracted LOX (n = 3). c. Determination of IC50 of each lysyl oxidase family member by PXS-5505 n = 20 (LOX), 3 (LOXL1), 10 (LOXL2), 3 (LOXL3), 4 (LOXL4). Data presented as mean values +/− SD. d. Plasma concentration profile over time in rats following administration of a single dose of PXS-5505 orally (10 mg/kg) or intravenously (5 mg/kg) e. PXS-5505 concentration, as measured by LC–MS/MS, in rat plasma, kidney, liver, lung, heart and ear samples following a single oral dose of 30 mg/kg (n = 3 independent animals). Data presented as mean values +/− SD. f. Plasma concentration profile over time in mice following oral administration of PXS-5505 (30 mg/kg) (n = 3 independent animals) g. Schematic of amplex red coupled fluorometric lysyl oxidase family activity assay whereby putrescine (put) is used as a substrate resulting in the release of H2O2 and its subsequent catalysis by horseradish peroxidase (HRP) to reduce amplex red to resorufin resulting in a fluorescently detectable signal. Using this assay, the concentration dependent PXS-5505 inhibition of lysyl oxidase family activity in conditioned media (CM) from KPC CAFs and cancer cells was measured (n = 3 biological repeats with 3 technical replicates per biological repeat). Data presented as mean values +/− SD. h. qRT-PCR showing in vitro 48 hour treatment of KPC CAFs or cancer cells with 30 μM PXS-5505 or vehicle control (n = 3 biological repeats with 3 technical replicates per biological repeat). Data presented as mean values +/− SD. Relative fold expression of lysyl oxidase family members from PXS-5505 treated samples compared to control were determined by the 2–∆∆Ct approach. p-values determined by unpaired, nonparametric t-test with a Mann–Whitney U correction (comparison between two groups). i. 2D in vitro cell viability assay (MTS assay) for KPC CAFs and CCs (n = 3 biological repeats with 3 technical replicates per biological repeat) in response to PXS-5505. Data presented as mean values +/− SD. Ordinary one-way ANOVA for multiple comparison test performed. j. 3D in vitro cell viability assay (MTS assay) for KPC CAFs and CCs (n = 3 biological repeats with 3 technical replicates per biological repeat) in response to PXS-5505. Data presented as mean values +/− SD. Ordinary one-way ANOVA for multiple comparison test performed.

