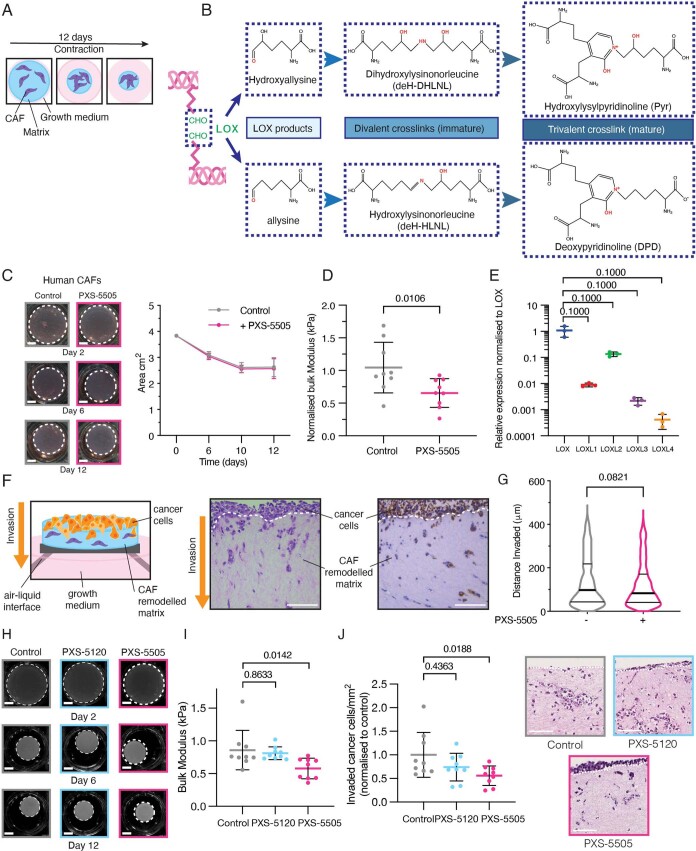
Extended Data Fig. 4. PXS-5505 inhibits collagen cross-linking by PDAC CAFs in vitro resulting in decreased cancer cell invasion.
a. Schematic of organotypic matrix remodeling assay whereby CAFs are embedded into a 3D collagen matrix and growth media supplemented with or without PXS-5505 to inhibit lysyl oxidase family activity b. Chemical structures of lysyl oxidase family catalyzed hydroxyallysine or allysine residues and the subsequent divalent and trivalent bonds that are formed that can be quantified by mass spectrometry. c. Representative images of 3D organotypic matrix contraction by human pancreatic cancer CAFs at days 2, 6 and 12 in the absence (gray) and presence (pink) of PXS-5505 (30 µM). Scale bars = 5 mm. Comparison of area of matrices between control and PXS-5505 treatment groups (n = 3 biological repeats with 3 technical replicates per biological repeat) over time showing no effect on CAF ability to contract matrices. p-value determined by unpaired, nonparametric t-test with a Mann–Whitney U correction (comparison between two groups). Data presented as mean values +/− SD. d. Treatment with PXS-5505 during remodeling leads to a decrease in stiffness (bulk modulus) of remodeled organotypic matrices. p-value determined by unpaired, nonparametric t-test with a Mann–Whitney U correction (comparison between two groups). Data presented as mean values +/− SD. e. qRT-PCR confirming expression of lysyl oxidase family members from human PDAC CAFs (n = 3 biological repeats with 3 technical replicates per biological repeat). p-value determined by unpaired, nonparametric t-test with a Mann–Whitney U correction (comparison between two groups). Data presented as mean values +/− SD. Relative fold expression of LOXL family members compared to LOX were determined by 2–∆∆Ct approach. f. Schematic of cancer cell invasion in a 3D organotypic matrix assay whereby cancer cells are seeded to the surface of a remodeled collagen plug and placed at an air–liquid interface and allowed to invade into the remodeled matrix. Example ROIs from H&E and panCK stained sections showing cancer cell invasion in the remodeled organotypic plug (3 biological repeats with 3 technical replicates per biological repeat). Scale bars = 100 μm. g. Comparison of invasion depth of cancer cells into 3D organotypic matrices as determined by PanCK staining n = -PXS-5505: 695 cells; +PXS-5505: 568 cells (taken from 3 technical replicates from 3 separate biological replicates), Data show distance invaded from the top of contracted matrix. p-value determined by unpaired, nonparametric t-test with a Mann–Whitney U correction (comparison between two groups). h. Representative images of 3D organotypic matrix contraction assay at days 2, 6 and 12 of control (gray) and presence of PXS-5120 (blue) and PXS-5505 (pink). Scale bars = 5 mm. Comparison of measured area of matrices between control, PXS-5120 and PXS-5505 treatment groups (n = 3) over time. i. Comparison of matrix stiffness by unconfined compression testing of PXS-5120, PXS-5505 and control treated matrices at day 12 (n = 3 biological repeats with 3 technical replicates per biological repeat). Data presented as mean values +/− SD. p-value determined by unpaired, nonparametric t-test with a Mann–Whitney U correction (comparison between two groups) j. Representative images of invasion of KPC cancer cells into a contracted organotypic matrix as determined by H&E staining. Comparison of number of cancer cells invaded per FOV as determined by H&E (9 images from 3 biological repeats with 3 technical replicates per biological repeat), shown as cells/mm2 and normalized to control (n = 9). Data presented as mean values +/− SD. p-value determined by unpaired, nonparametric t-test with a Mann–Whitney U correction (comparison between two groups).

