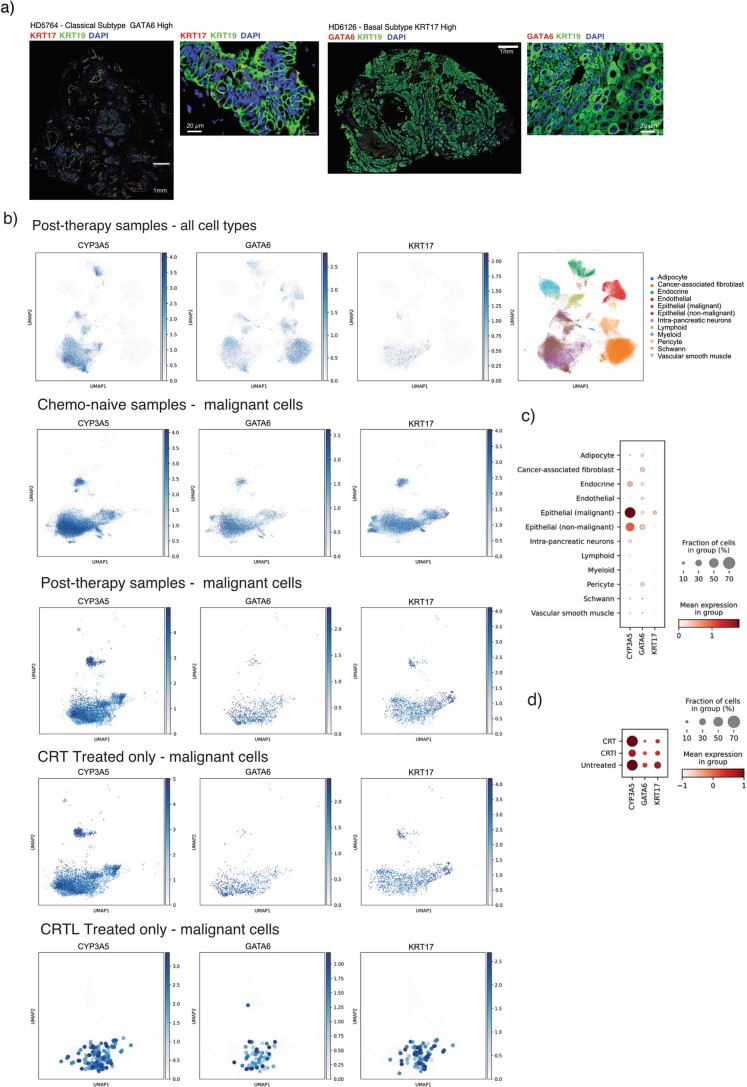
Extended Data Fig. 3. Multiplexed IF and single nuclei RNAseq identifies complex intratumor heterogeneity.
a) Multiplexed IF showing the spatial expression of KRT17 and GATA6 in Classical subtype GATA6 High and Basal subtype KRT17 High samples, respectively. These images correspond to whole tissue sections shown in Fig. 2d. Scale bars are shown in the images. b) Reanalysis of single nuclei RNAseq data first published in Hwang et al.16 demonstrating the presence of GATA6, KRT17 and CYP3A5 co-expressing cells in chemo-naïve samples that persist following chemotherapy and nearly always radiotherapy. UMAP embeddings of single nuclei gene expression profiles representing the indicated cell types in chemo-naïve and post-therapy patient samples. CRT denotes chemoradiotherapy (FOLFIRINOX as the major chemotherapy regimen) and CRTL denotes chemoradiotherapy (FOLFIRINOX as the major chemotherapy regimen) plus losartan. c) Dot plot showing the relative enrichment of GATA6, CYP3A5, and KRT17 in cell types comprising post-CRT samples. d) Dot plot showing the relative enrichment of GATA6, CYP3A5, and KRT17 in chemo-naïve (untreated) and post-CRT or post-CRTL patient samples.

