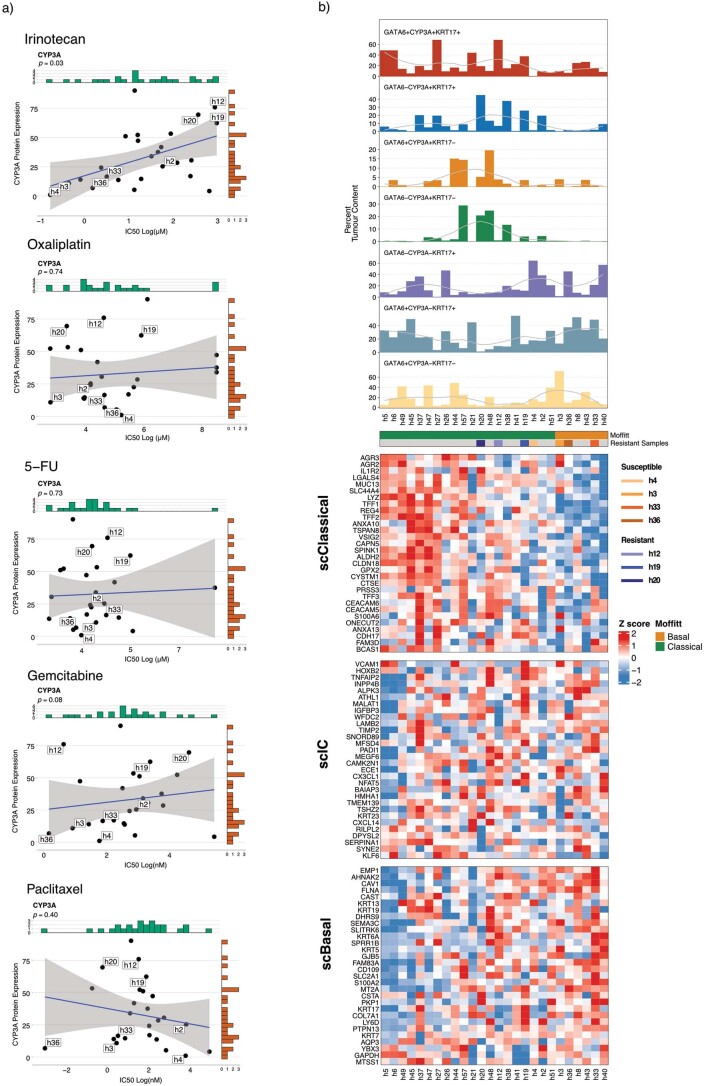
Extended Data Fig. 8. CYP3A protein expression in PDOs is positively correlated with irinotecan resistance.
a) Scatter plots showing the correlations between CYP3A protein expression and Log (IC50) values for the indicated chemotherapies. Winsorized correlations (two-sided) were performed to reduce the effect of outliers. P-values are shown on each correlation plot with P-value ≤ 0.05 considered significant. The plots show a solid regression line and error bands representing 95% confidence intervals. P-values were not adjusted for multiple testing. b) CYP3A-positive ‘Hybrid’ cells overlap scClassical and scIC gene signatures. Top panel, bar plots showing the percent tumour content of GATA6/CYP3A/KRT17 hybrid cell types in PDOs. A LOESS regression line has been added to each bar plot. Bottom panel, heatmap showing the relative expression of gene signatures derived from single cell analyses that define distinct Classical (scClassical), Basal (scBasal) and Intermediate co-expressor (IC) cell phenotypes. PDOs are grouped by Moffitt subtype.

