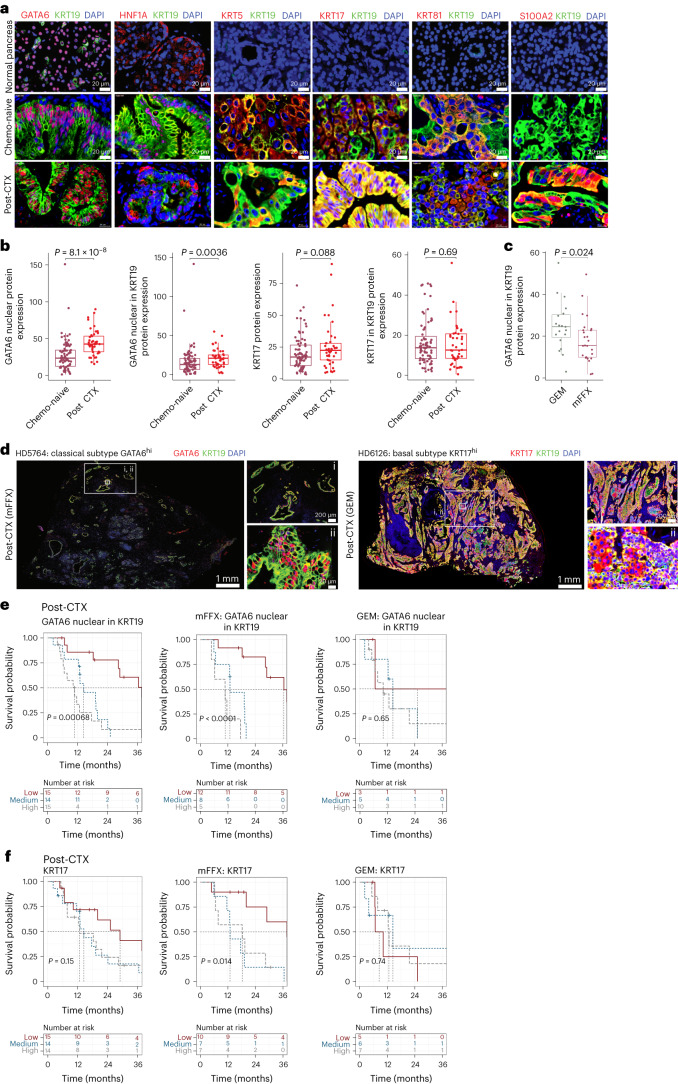
Fig. 3. Classical and basal biomarker analysis of chemo-naive and post-CTX samples using multiplexed IF.
a, Multiplexed IF images of representative normal (n = 9), chemo-naive (n = 77) and post-CTX (n = 45) samples stained with GATA6 (red), HNF1A (red), KRT5 (red), KRT17 (red), KRT81 (red), S100A2 (red) and KRT19 (green) antibodies. b, Box plots showing relative whole-section protein expression of the indicated biomarkers in chemo-naive (n = 77) and post-CTX (n = 45) samples. Biomarker protein expression is considered alone or in the context of KRT19 coexpression. Kruskal–Wallis rank-sum test (two-sided) P values are provided at the top of each plot. c, Box plot showing relative whole-section protein expression of nuclear GATA6 in KRT19+ cells between GEM (n = 19) and mFFX (n = 25) post-CTX samples. The Kruskal–Wallis rank-sum test (two-sided) P value is provided at the top. d, Multiplexed IF images of representative classical and basal post-CTX samples stained with GATA6 (red), KRT17 (red) and KRT19 (green) antibodies. Representative images are presented in rows, with the leftmost image showing the entirety of the imaged region. The top right image and bottom right image show selected regions (i and ii) at increased magnification. e,f, Kaplan–Meier survival analysis for high, medium and low GATA6 and KRT17 protein expression tertiles in post-CTX PDAC-HD samples. Kaplan–Meier survival analyses for post-CTX samples representing combined (GEM and mFFX) treatment, GEM alone or mFFX alone are shown. Participant numbers for each group are provided under ‘Numbers at risk’. A log-rank P value of ≤0.05 is considered significant. All box plots show the median (line), the interquartile range (IQR) between the 25th and 75th percentiles (box) and 1.5× the IQR ± the upper and lower quartiles. P values were not adjusted for multiple testing.

