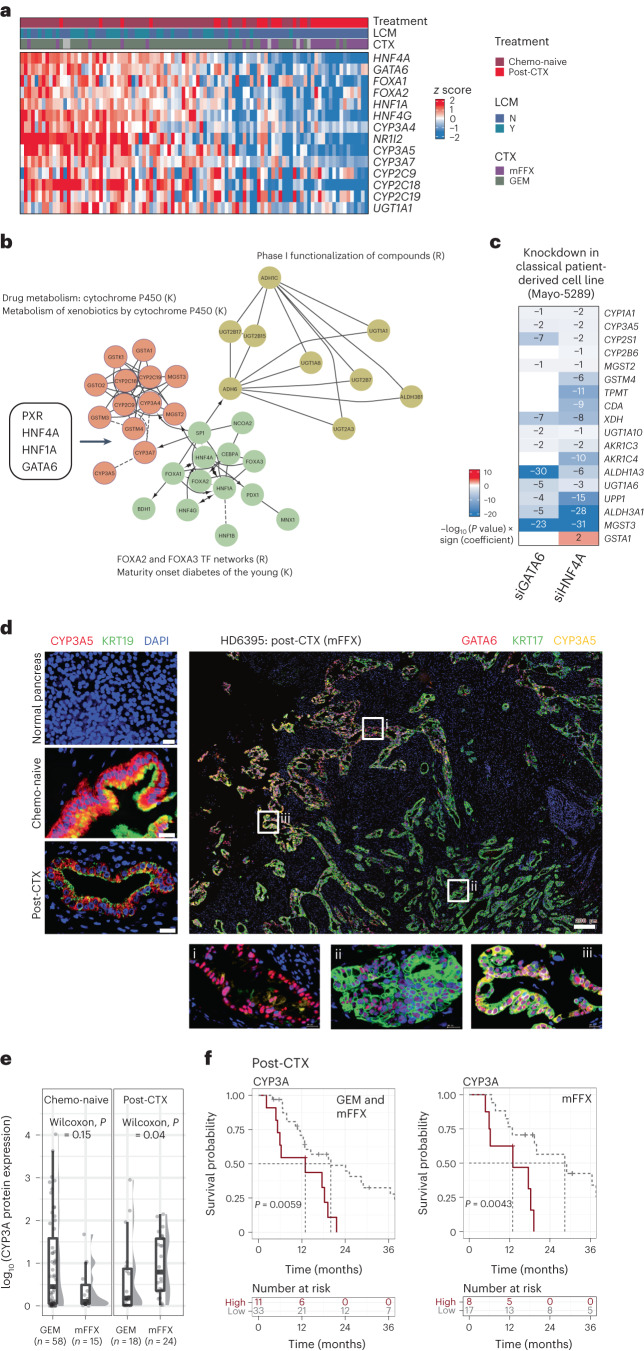
Fig. 5. CYP3A protein expression in mFFX post-CTX samples is associated with patient outcome.
a, Heat map showing mRNA expression of coexpressed genes associated with drug metabolism and phase I functionalization of compounds. b, Network of coexpressed genes that are enriched in classical-like samples. Gene nodes (circles) are colored according to their annotated molecular functions. K denotes annotated KEGG pathways, and R denotes annotated REACTOME pathways. Transcription factors that regulate the network of genes are shown in the adjacent box. c, RNA-seq reanalysis of GATA6 and HNF4A siRNA knockdown experiments performed in a classical human-derived cell line (n = 3 control; n = 3 siRNA) as described in Brunton et al.31. Heat map values represent –log10 (P values) × sign (coefficient). Blue color indicates downregulation in siRNA-treated cells. P values represent the significance of a two-sided Wald test and were adjusted for multiple testing. d, Left, multiplexed IF images of representative normal, chemo-naive and post-CTX PDAC-HD samples showing spatial expression of CYP3A relative to KRT19-expressing cells. Right, multiplexed IF images of a representative post-CTX sample analyzed with antibodies to GATA6 (red), KRT17 (green) and CYP3A (yellow); scale bar, 200 μm (whole-section image). ROIs demarcated by white boxes and labeled by i, ii or iii are shown at higher magnifications; scale bar, 20 μm. ROIs represent dominant GATA6 staining (i), dominant KRT17 staining (ii) and ‘hybrid’ GATA6+KRT17+CYP3A+ (iii) staining. e, Box plots showing protein expression by IF of CYP3A according to treatment. Kruskal–Wallis rank-sum test (two-sided) P values are shown on the plots. Box plots show the median (line), the IQR between the 25th and 75th percentiles (box) and 1.5× the IQR ± the upper and lower quartiles. P values were not adjusted for multiple testing. f, Kaplan–Meier survival analysis for high (highest 25% of IF values) and low CYP3A protein expression (remainder of IF values) in post-CTX PDAC-HD samples combined (GEM and mFFX) or in mFFX samples alone. Participant numbers for each group are provided under ‘Numbers at risk’. A log-rank P value of ≤0.05 is considered significant. P values were not adjusted for multiple testing.

