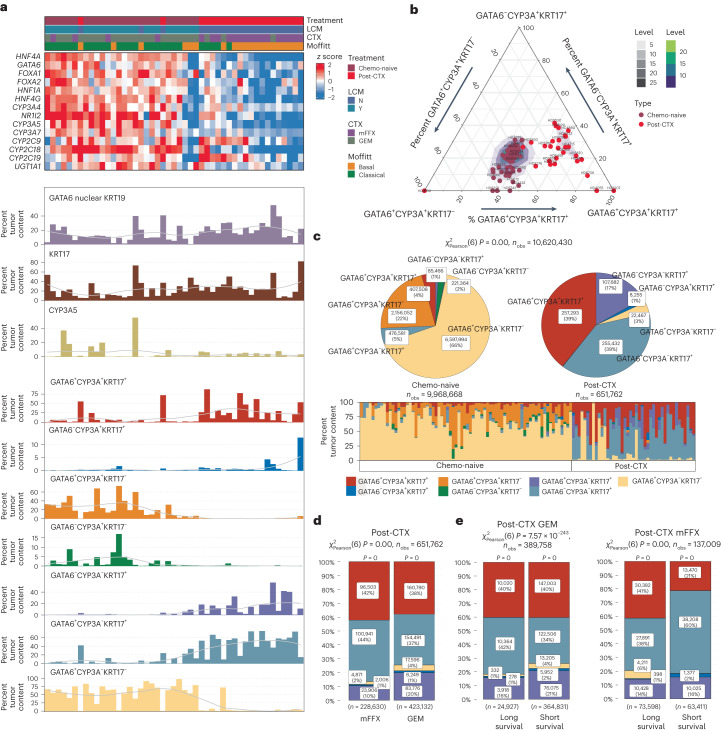
Fig. 6. Multiplexed GATA6, KRT17 and CYP3A IF identifies CYP3A ‘hybrid’ persister phenotypes enriched in post-CTX samples.
a, Top, heat map showing the relative mRNA expression of coexpressed genes associated with drug metabolism and phase I functionalization of compounds. Bottom, bar charts showing the percent tumor enrichment of GATA6/CYP3A/KRT17 cell populations as determined by multiplexed IF. Samples used to generate the data in the top and bottom are identical (n = 47) and are similarly ordered. A LOESS regression line has been added to each bar plot. b, Ternary plot showing the percent tumor content of GATA6, CYP3A and KRT17 cell populations in chemo-naive (n = 69) and post-CTX (n = 42) samples. Post-CTX samples show an enrichment for CYP3A+ ‘hybrid’ persister phenotypes. c, Pie stat plots and bar chart showing significant enrichment of GATA6/CYP3A/KRT17 ‘hybrid’ persister phenotypes in chemo-naive (n = 69) and post-CTX (n = 42) samples. Pearson chi-squared test of independence (two sided) is highly significant (P = 0) given a large sample size (nobs = 10,620,430 cells). d, Bar stat plot showing the percentage of GATA6/CYP3A/KRT17 ‘hybrid’ cell phenotypes in post-CTX samples treated with either GEM (n = 18) or mFFX (n = 24). e, Bar stat plots showing the percentage of GATA6/CYP3A/KRT17 ‘hybrid’ cell phenotypes enriched in samples treated preoperatively with either GEM (n = 18) or mFFX (n = 24) and associated with long and short survival. For bar stat plots, Pearson chi-squared test of independence (two sided) is highly significant (P = 0) given the large sample sizes (nobs = 651,762 cells for GEM/mFFX in d, and nobs = 389,758 cells for GEM and nobs = 137,009 cells for mFFX in e). The P values from a one-sample proportions test (two sided) are displayed on the top of each bar. P values were not adjusted for multiple testing.

