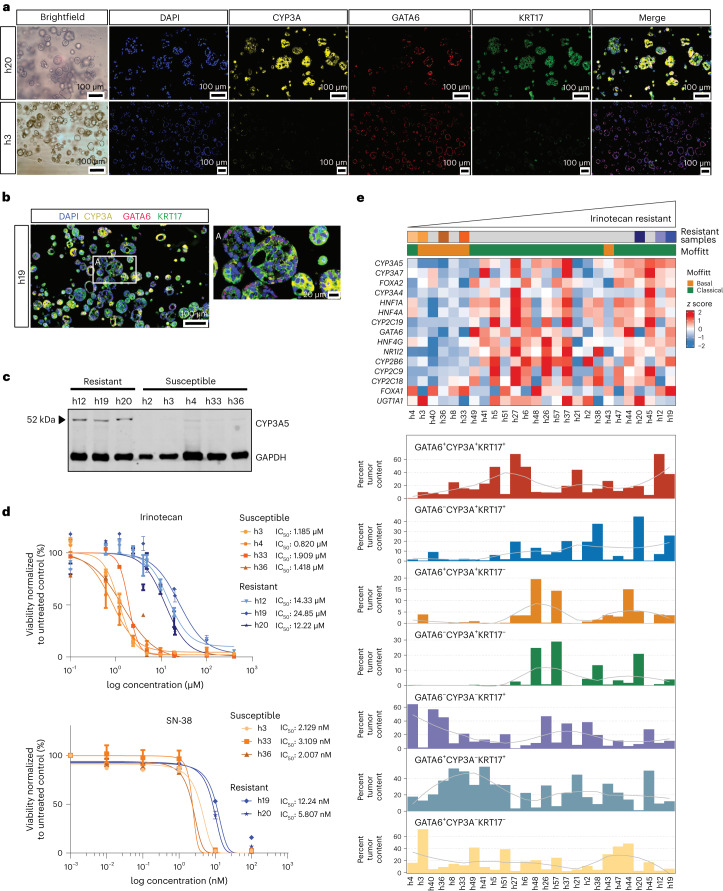
Fig. 7. CYP3A protein expression is positively associated with irinotecan drug tolerance.
a, Multiplexed IF of representative PDOs showing high relative CYP3A protein expression in resistant (h20) versus sensitive (h3) PDOs. b, Multiplexed IF of an irinotecan-resistant PDO (h19) showing mosaic GATA6/CYP3A/KRT17 protein expression. The ROI demarcated by a white box and labeled with i is shown at higher magnification. c, Western blot showing protein expression of CYP3A between PDOs exhibiting resistance or susceptibility to irinotecan. GAPDH is used as a loading control. d, Drug response curves showing half-maximal inhibitory concentration (IC50) values for both irinotecan and SN-38 in selected PDOs that are either relatively resistant or relatively susceptible. The results represent n = 3 independent biological experiments. Data are presented as mean values ± s.e.m. e, Relative enrichment of CYP3A+ ‘hybrid’ cell phenotypes in PDOs. Top, heat map showing mRNA expression of coexpressed genes associated with drug metabolism and phase I functionalization of compounds. Bottom, bar charts showing the percent tumor enrichment of GATA6/CYP3A/KRT17 cell populations as determined by multiplexed IF. PDOs in the top and bottom are identical and are ordered according to increasing irinotecan IC50 values. A LOESS regression line has been added to each bar plot.

