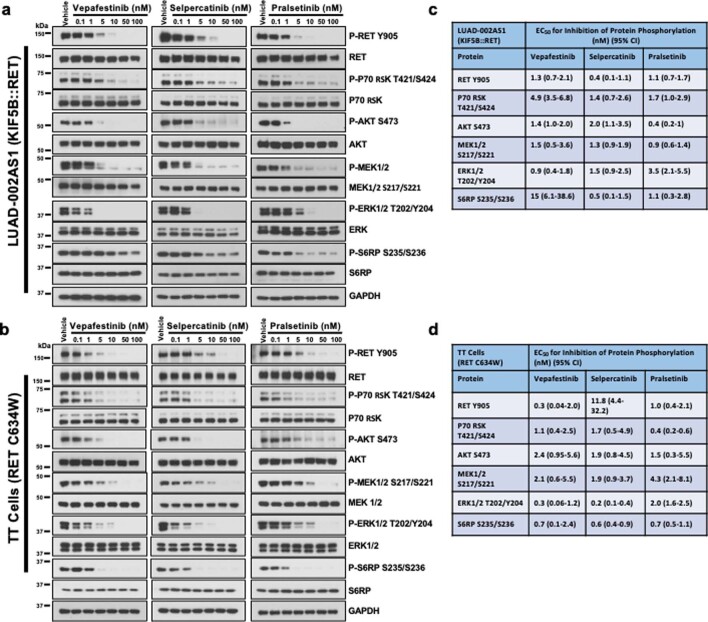
Extended Data Fig. 4. Inhibition of protein phosphorylation by RET-selective inhibitors.
Cells were deprived of serum for 24 h before treatment with the indicated concentrations of inhibitors for 2 h. Whole-cell extracts were then prepared, resolved by SDS-PAGE and immunoblotted for the total or phosphorylated (P) protein shown. (a-b) Representative immunoblots from two independent Western blotting analysis are displayed. GAPDH was used as a loading control. (c-d) Blots were quantitated by densitometry and then the ratio of phosphorylated protein to total protein was analyzed by non-linear regression using Graphpad Prism v9 software to find the EC50 for inhibition of phosphorylation. Data represent the mean of two independent measurements with the 95% confidence interval (CI) shown in brackets. On each immunoblot, the vehicle-treated control was considered 100% phosphorylation and all other conditions are repressed relative to this. These values were adjusted for any change in protein expression by dividing by the corresponding total protein relative densitometry reading.

