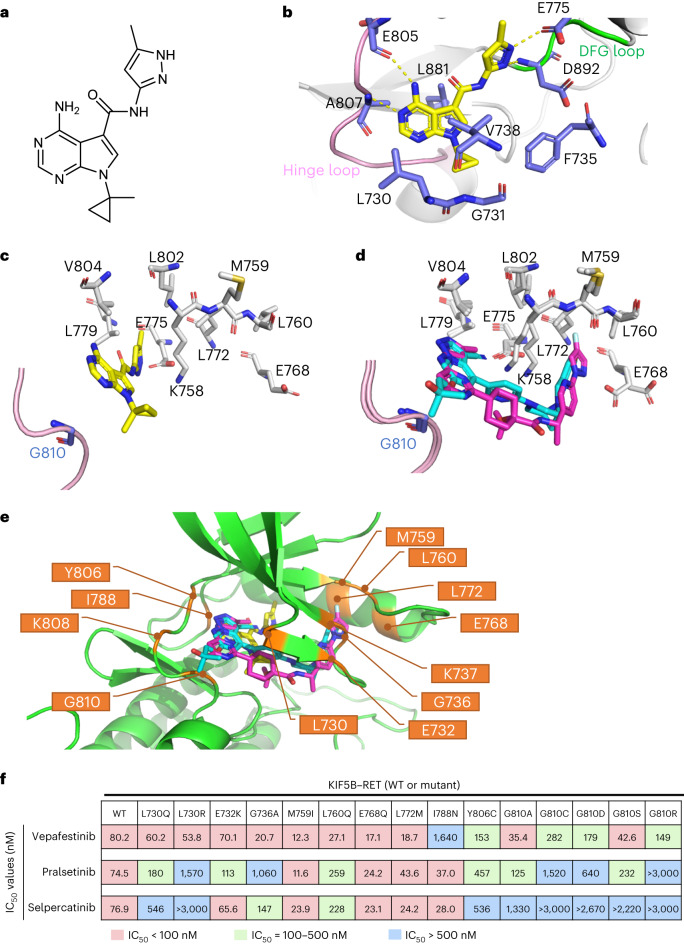
Fig. 2. X-ray crystallography of RET complexed with RET-selective inhibitors.
a, Chemical structure of TAS-C1. b, X-ray structure of RET complexed with TAS-C1. c, View from the solvent front area in the co-crystal structure of RET with TAS-C1. d, Overlay of co-crystal structures of selpercatinib and pralsetinib bound to RET. The viewpoint is the same as in c. The binding compounds are shown as stick models, with yellow (TAS-C1), cyan (selpercatinib) and magenta (pralsetinib) representing each RET inhibitor. e, Positions of the amino acid residues where mutagenesis was performed for in-cell western assays are shown in the co-crystal structure of RET with TAS-C1, overlaid with selpercatinib and pralsetinib. f, IC50 values calculated from in-cell western assays of Jump-In GripTite HEK293 cells transiently expressing WT or mutant KIF5B–RET. Cells were treated with the indicated compounds for 1 h. The assay was performed in triplicate, and mean IC50 values are represented with the color codes shown at the bottom.

