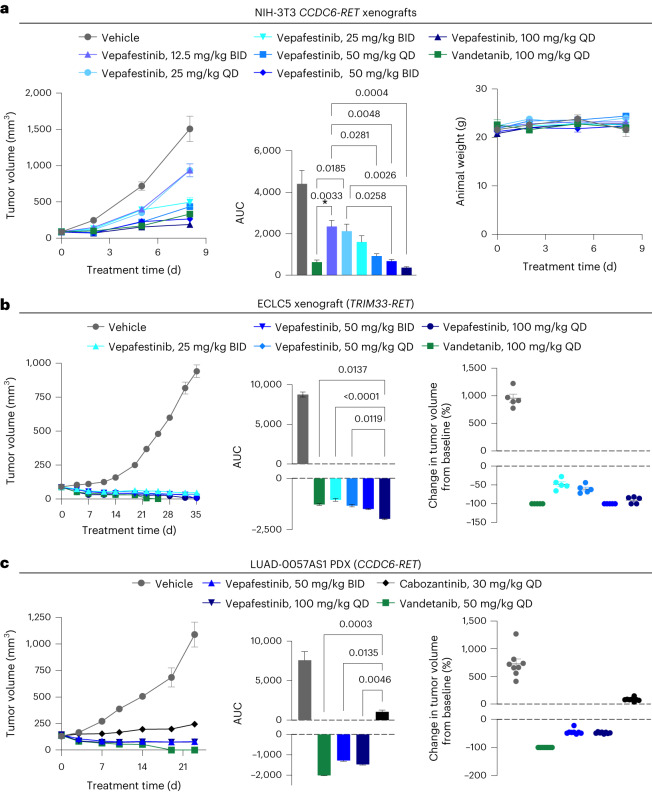
Fig. 5. Efficacy of vepafestinib in RET fusion-dependent disease models in vivo.
Cell lines (NIH-3T3 expressing CCDC6–RET, ECLC5) or PDX tumors were implanted into subcutaneous flanks of female mice and treated as indicated. a, NIH-3T3-RET xenograft (athymic nude mice). b, ECLC5 xenograft (NOD–SCID gamma (NSG) mice). c, LUAD-0057AS1 PDX. a–c, Left, time course of treatment. Data represent mean ± s.e.m. There were five (NIH-3T3-RET and ECLC5 xenografts) or eight (LUAD-0057AS1) animals per group. a–c, Middle, AUC analysis of tumor growth. Data represent mean ± s.e.m. of n = 12 (NIH-3T3-RET), n = 32–44 (ECLC5) or n = 46–49 (LUAD-0057AS1) values per group. a, Right, animal weight. b,c, Right, percent change in the volume of individual tumors at the end of the study. Mean ± s.e.m. are shown. The volume of tumors in all treatment groups in each model was significantly lower than that of the respective vehicle-treated groups (P < 0.0001). P values for statistical significance are shown for other comparisons (ANOVA with Dunnett’s multiple-comparison test). All tests were two sided.

