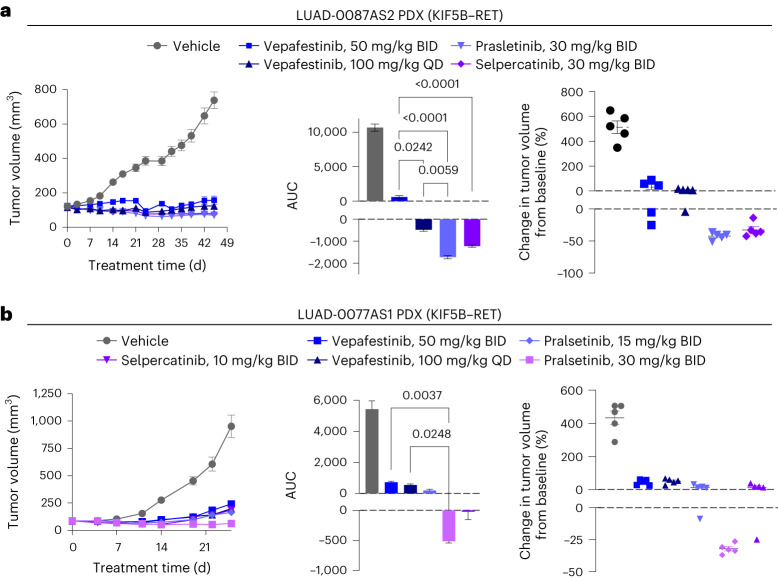
Fig. 6. Efficacy of vepafestinib compared to other RET-selective inhibitors in PDX models.
a, LUAD-0087AS2 PDX. b, LUAD-0077AS1 PDX. a,b, Left, time course of treatment. Data represent mean ± s.e.m. There were five mice in each group in both models. a,b, Middle, AUC analysis of tumor growth. Data represent mean ± s.e.m. of n = 56 (LUAD-0087AS2) or n = 32 (LUAD-0077AS1) values per group. a,b, Right, percent change in the volume of individual tumors at the end of the study. Mean ± s.e.m. are shown. Each group consisted of five animals. The volume of tumors in all treatment groups in each model was significantly lower than that of the respective vehicle-treated groups (P < 0.0001). P values for significance are shown for other comparisons (ANOVA with Dunnett’s multiple-comparison test). All tests were two sided.

