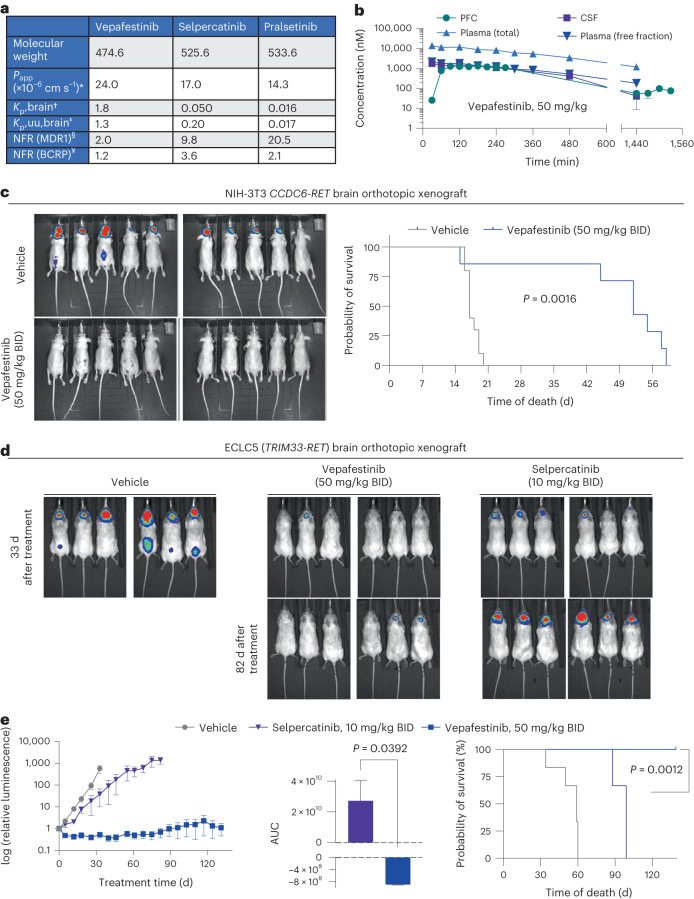
Fig. 8. Vepafestinib is more effective than selpercatinib at penetrating the brain and blocking intracranial tumor growth.
a,b, Pharmacokinetic properties. a, *Apparent permeability coefficient (Papp) values were calculated as the mean of Papp values in the apical-to-basal direction in mock-transfected LLC-PK1 cells. †,‡Total (Kp,brain) and unbound (Kp,uu,brain) brain/plasma concentration ratios were calculated based on total and unbound concentrations in plasma and brain at 0.5 h or 1 h after oral administration of each agent to male BALB/c mice dosed with 50 mg per kg drug. Unbound fractions in plasma (fu,plasma) and brain (fu,brain) were obtained by the equilibrium dialysis method with plasma and brain homogenate. §,¥Net flux ratio (NFR) values for MDR1 (P-gp) and BCRP were obtained from transcellular transport assays using control or MDR1-expressing LLC-PK1 cells and control and BCRP-expressing MDCK II cells. b, Single-dose vepafestinib (3 mg per kg, 10 mg per kg or 50 mg per kg) was administered orally to male Han Wistar rats at time = 0 min (n = 12 per dosing group). Following equilibration, samples were collected at the indicated time points, and vepafestinib concentrations were then determined. Data for all dosages are shown in Extended Data Fig. 10. Data represent mean ± s.e.m. (n = 4 independent measurements in four animals). c, NIH-3T3 CCDC6-RET cells harboring a luciferase reporter were implanted intracranially into nude mice and treated with vehicle or 50 mg per kg vepafestinib BID. Treatment started 5 d after implantation. Bioluminescence images of animals 13 d after implantation are shown (left). Survival curves of each group are shown after implantation (n = 10, vehicle group; n = 7, vepafestinib group) (right). There was a significant difference in survival between the vehicle group and the vepafestinib group (P = 0.0016, log-rank test). d, ECLC5 cells labeled with a luciferase reporter were implanted intracranially into NSG mice and treated with vehicle, selpercatinib (10 mg per kg) or vepafestinib (50 mg per kg) BID. Treatment started 10 d after implantation. There were six animals in each group. d, Bioluminescence images of animals are shown for the last day when all animals were alive in the three groups (43 d after implantation) and at 92 d after implantation for the two treatment arms. e, Luciferase signals were quantified and are shown (left). Data represent mean ± s.e.m. (n = 6 per group). AUC analysis was performed for the selpercatinib and vepafestinib groups (middle, Brown–Forsythe and Welch ANOVA tests). For AUC, data represent mean ± s.e.m. of n = 100 (vepafestinib) or n = 65 (selpercatinib) values. Survival curves are shown for animals after treatment began (right). Treatment with selpercatinib (P = 0.0008, log-rank test) and vepafestinib (P = 0.0008, log-rank test) increased survival relative to the vehicle. However, animals treated with vepafestinib had longer survival (P = 0.001, log-rank test). All statistical tests were two sided.

