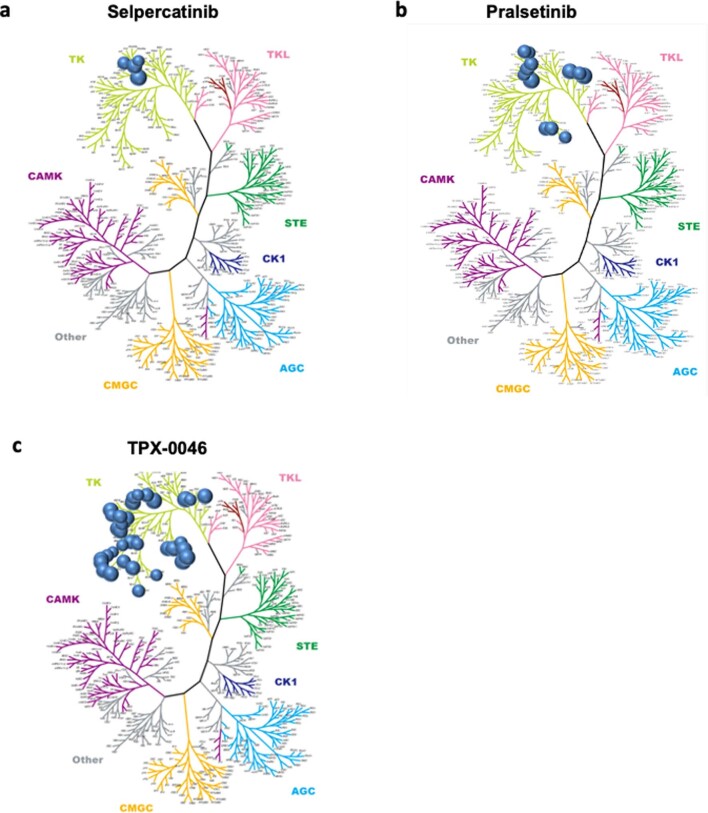
Extended Data Fig. 1. Selectivity profile of RET inhibitors.
We performed kinase selectivity profile across 256 kinases in the presence of (a) 22 nM selpercatinib (b) 17 nM pralsetinib or (c) 26 nM TPX-0046/enbezotinib. These concentrations are approximately 100-fold higher than the corresponding IC50 value for inhibition of RETWT enzymatic activity. Kinases that were inhibited by ≥50% by each small molecule are plotted as a circle on the kinome tree in the respective panel.

