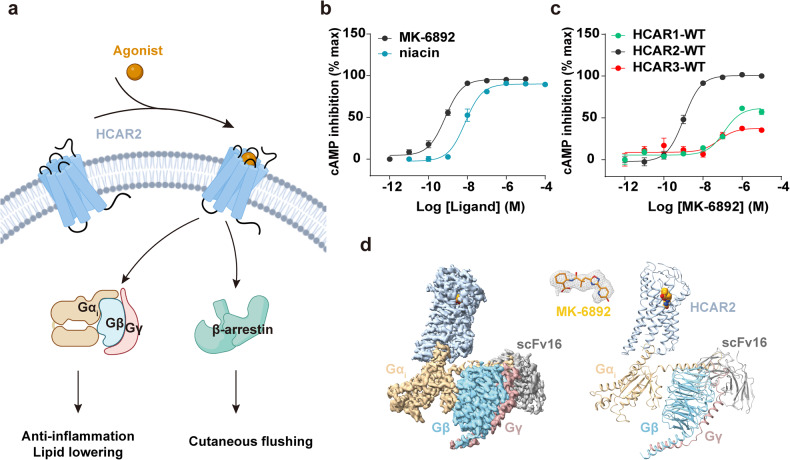
Fig. 1.
Signal transduction and structure of MK-6892-HCAR2-Gi complex. a Downstream signals and functions mediated by HCAR2. The schematic figure created with BioRender.com. b Represented curve for niacin and MK-6892-induced HCAR2 activation examined by cAMP inhibition assay. c Activating effect of MK-6892 on HCARs by cAMP inhibition assay. Data are presented as the mean ± SEM of three independent experiments performed in triplicate. d The cryo-EM map (left panel) and structural mode (right panel) of MK-6892-bound to HCAR2 in complex with Gi heterotrimer and scFv16. Orange, MK-6892; Light steel blue, HCAR2; Tan, Gαi; Sky blue, Gβ; Rosy brown, Gγ; Dark gray, scFv16. The EM density of HCAR2-Gi complex and MK-6892 was shown with the counter level of 0.62, 0.469 respectively

