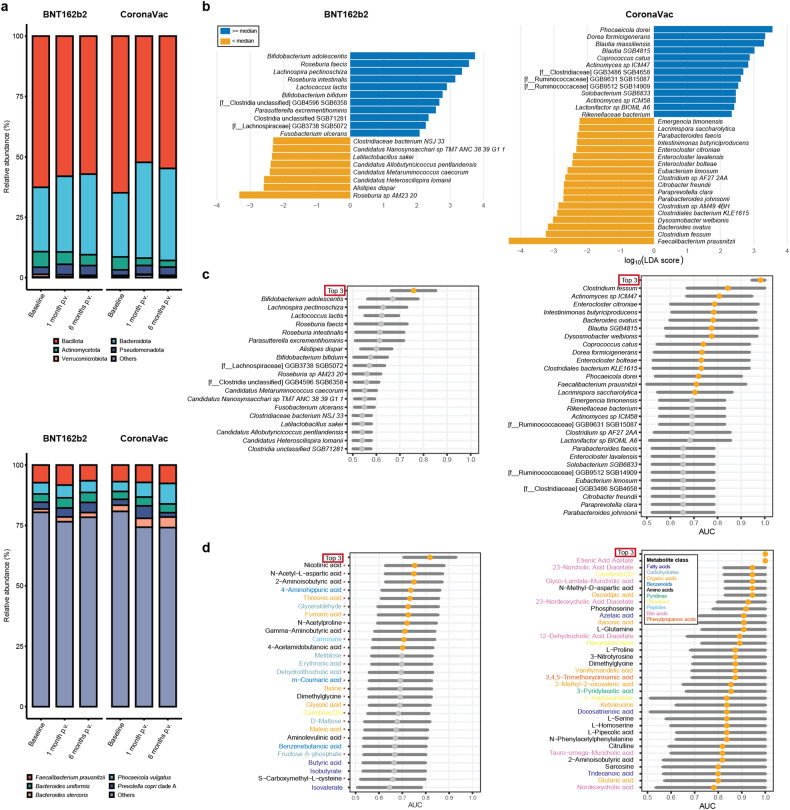
Fig. 2.
Baseline gut microbiome and metabolome biomarkers of sVNT levels to the BNT162b2 and CoronaVac vaccines at 6 months p.v. a Average relative abundances of the five most abundant and other bacterial phyla (upper panel) and species (lower panel). b Baseline gut microbiome biomarkers detected by LEfSe. c AUROC (95% CI) values of models based on individual microbiome biomarkers and a combined model based on the top three most predictive biomarkers for high vs. low sVNT levels at 6 months p.v. d AUROC (95% CI) values of models based on individual metabolite biomarkers and a combined model based on the top three most predictive metabolite biomarkers for high vs. low sVNT levels at 6 months p.v. Only markers with a lower bound for the AUROC of >0.5 were shown. An AUROC of >0.7 was presented as an orange dot. Red asterisks denote metabolites that were positively associated with durable immunity. Elements on forest plots: centre dot, mean AUROC; horizontal line, 95% confidence interval

