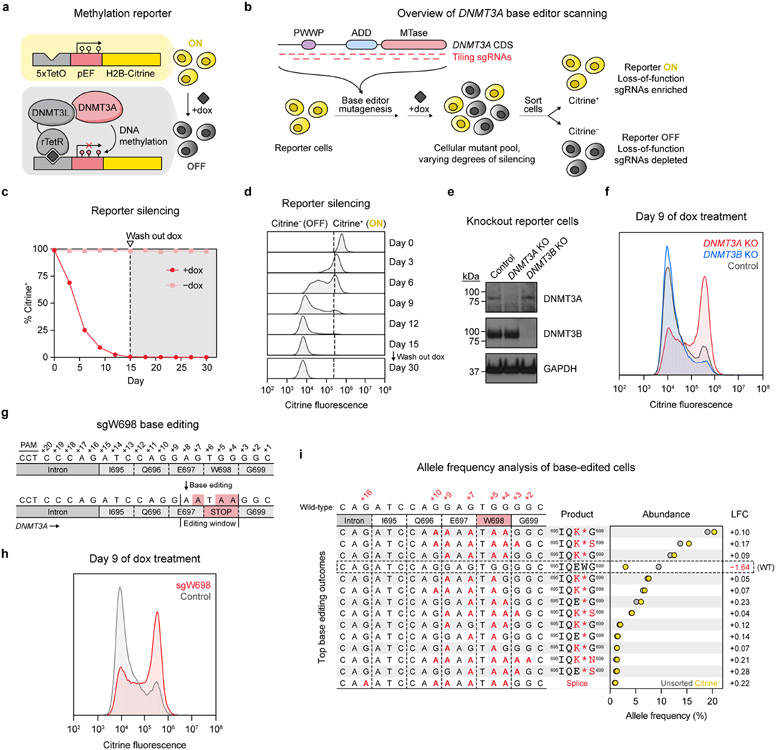
Fig. 1 ∣. A live-cell reporter enables fluorescence-based readout of endogenous DNMT3A activity.
a. Schematic of the methylation reporter. TetO, tetracycline operator; pEF, EF1α promoter; rTetR, reverse tetracycline repressor. Red lollipops indicate DNA methylation.
b. Overview of DNMT3A base editor scanning experiment.
c. Timecourse of reporter silencing measured by flow cytometry. Dotted line indicates dox washout on day 15. Data are mean ± SD of n = 3 replicates.
d. Citrine fluorescence of dox-treated cells at indicated timepoints from c.
e. Immunoblot of DNMT3-knockout reporter cells. Control, sgRNA recognizing the luciferase coding sequence (nontargeting sgLucA). Uncropped images are provided as Source Data.
f. Citrine fluorescence of cells from e measured by flow cytometry after 9 d of dox treatment.
g. sgW698 target site in DNMT3A. Numbers indicate positions along the protospacer (antisense to the DNMT3A gene). Expected base editing mutations are highlighted in red (these appear as G to A because the protospacer is along the opposite strand).
h. Citrine fluorescence of cells treated with sgW698 or sgLucA control measured by flow cytometry after 9 d of dox treatment.
i. Allele frequencies in cells edited with sgW698 after 9 d of dox treatment, either sorted for citrine+ cells (yellow dots) or unsorted (gray dots). The wild-type allele is boxed, and only alleles with ≥1% allele frequency in at least one sample are shown. Protein product sequences are shown with nonsynonymous mutations in red. Splice, splice site mutation; LFC, log2(fold-change allele frequency in citrine+ versus unsorted cells). Genotyping was performed once (n = 1).
Histograms of citrine fluorescence in d, f, and h are representative of n = 3 replicates, and full results are shown in c and Extended Data Fig. 1d,e. Results in c–f and h are representative of two independent experiments. See also Extended Data Fig. 1.

