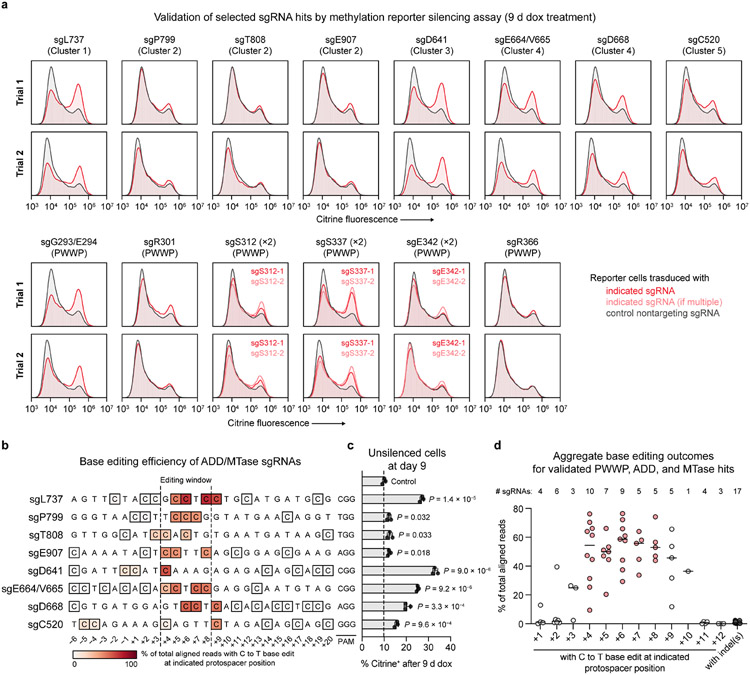
Extended Data Fig. 5 ∣. Individual validation of sgRNA hits.
a, Citrine fluorescence of base-edited cells after 9 d of dox treatment for 17 sgRNAs targeting DNMT3A (red or light red). Histograms are representative of n = 3 replicates. Top and bottom plots show data from two independent experimental trials (independent transductions). The citrine fluorescence histogram of nontargeting sgLucA control cells treated with dox in parallel (gray) is overlaid in each plot. Control data shown are identical for samples analyzed in the same experiment. Data shown in Fig. 4d corresponds to trial 2 shown here. b, Next-generation sequencing analysis of base editing efficiency at each C within the target sites of the indicated sgRNAs. Allele tables are provided in Supplementary Data 5. c, Flow cytometric quantification of cells remaining citrine+ after 9 d of dox treatment. Data correspond to those shown in a (trial 2), and are mean ± SD of n = 3 replicates. P values were calculated through two-tailed unpaired t tests comparing each sgRNA to sgLucA control. d, Aggregate base editing outcomes for the 17 sgRNAs presented in a (includes PWWP, ADD, and MTase hit sgRNAs). The efficiency of base editing is plotted at each protospacer position for all sgRNAs containing a C at that position. Horizontal lines indicate the median at each position. The number of sgRNAs (n) with a C at each position is printed above the plot. Protospacer positions within the editing window (+4 to +8) are highlighted in red. The indel frequencies for all sgRNAs (n = 17) are shown to the right in dark gray. Genotyping was performed once for each sgRNA.

