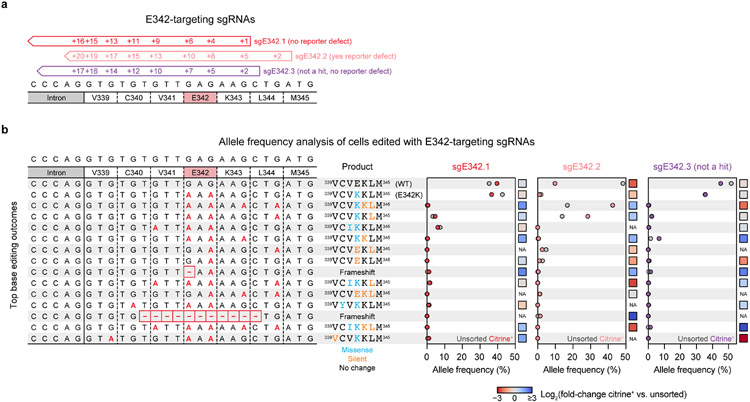
Extended Data Fig. 7 ∣. Analysis of base editing outcomes for three sgRNAs targeting the E342 codon of DNMT3A.
a, Schematic of sgRNAs targeting the E342 codon. sgE342.1 (red) and sgE342.2 (light red) correspond to the screening hits presented in Fig. 4 and Extended Data Fig. 5. sgE342.3 (purple) is an additional library sgRNA that did not score as a hit in the screen but also targets the E342 codon. b, Allele frequencies in base-edited reporter cells after 15 days of dox treatment, comparing citrine+ cells to unsorted cells. Genomic DNA was harvested using QuickExtract DNA extraction solution (Lucigen) and libraries were prepared and deep sequenced as for other genotyping experiments. Each row represents an allele (for the purposes of this analysis, alleles were merged if they were identical within the region depicted here). All alleles having at least 1% allele frequency in at least one sample are depicted. Left, nucleotide sequence of each allele, with C to T base edits shown in red (these appear as G to A because the protospacers are along the opposite strand) and deletions represented by dashes. Middle, amino acid sequence corresponding to the translation of the region shown, with missense and silent mutations colored blue and orange, respectively. Right, allele frequencies in unsorted or citrine+ cells for each sgRNA. Colored dots, citrine+ cells; gray dots, unsorted cells. Colored squares to the right of each plot indicate the log2(fold-change in allele frequency in citrine+ vs. unsorted cells). NA indicates undefined log2(fold-changes) where one or both of the allele frequencies is zero. This experiment was conducted once (n = 1).

