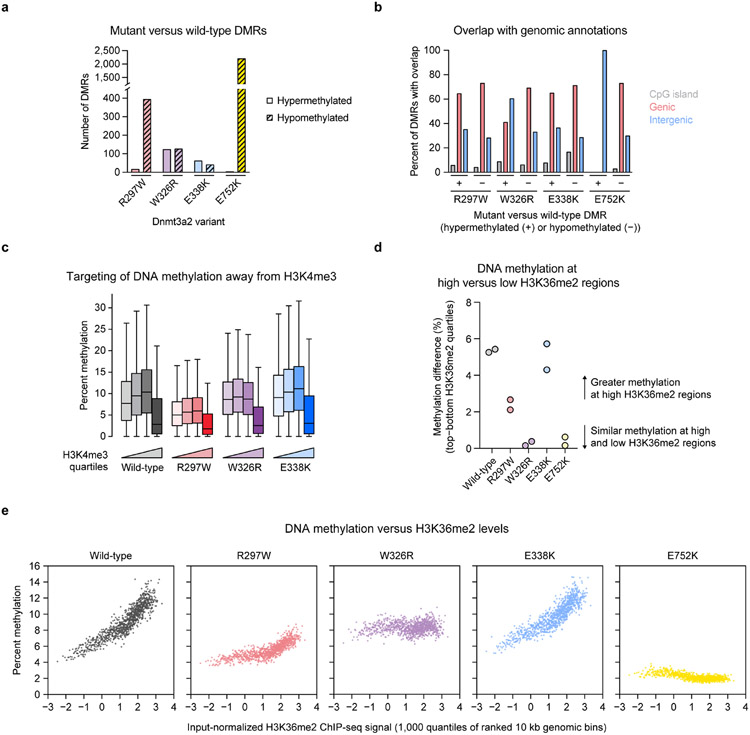
Extended Data Fig. 9 ∣. Additional analysis of de novo DNA methylation in Dnmt3a2-complemented TKO ESCs.
a, Counts of hypermethylated and hypomethylated differentially methylated regions (DMRs) called for each mutant Dnmt3a2 compared to wild-type Dnmt3a2. b, Overlap of called DMRs with three genomic annotations: CpG islands (gray), genic regions (red), and intergenic regions (blue). Hypermethylated and hypomethylated DMRs for each mutant were considered separately. The plot displays the percentage of DMRs in each group with any overlap with each genomic annotation. c, CpG methylation within 10 kb genomic bins ranked into quartiles based on normalized H3K4me3 ChIP-seq signal (n = 23,379 bins per quartile). Center line, median; box, interquartile range; whiskers, up to 1.5 × interquartile range per the Tukey method; outliers not shown. d, Difference in CpG methylation between top and bottom H3K36me2 quartiles for each sample. 10 kb genomic bins (n = 93,516 total) were grouped into quartiles, and the average methylation in the median bins from the top and bottom quartiles were compared. Biological replicates are shown separately (n = 2). e, CpG methylation within 10 kb genomic bins ranked into quantiles (n = 1,000 quantiles) based on normalized H3K36me2 ChIP-seq signal. The average bin methylation for each quantile is plotted against the H3K36me2 signal. For a–e, only CpGs with 5× coverage across all samples were considered. Methylation values in c and e represent the average of two biological replicates.

