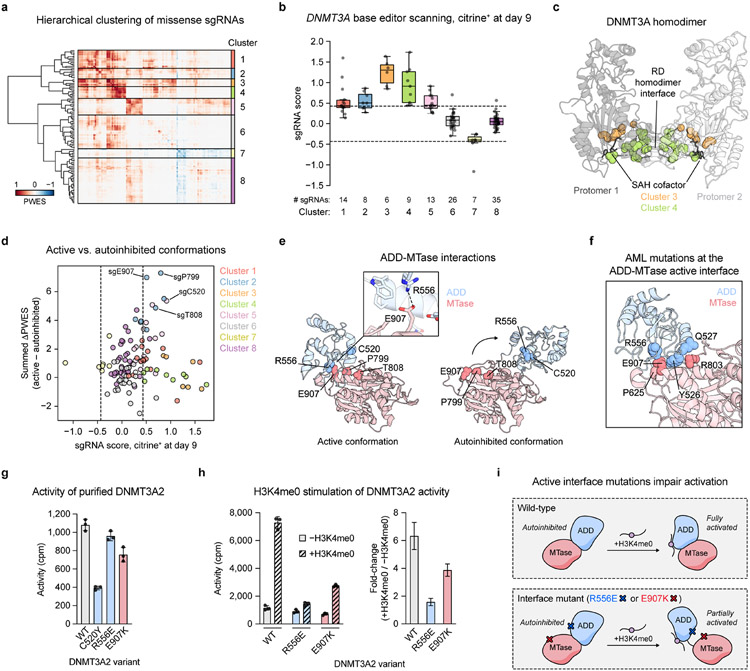
Fig. 3 ∣. Functional hotspot analysis highlights an interdomain interface important for allosteric activation.
a. Heatmap depicting the PWES matrix for all pairs of missense sgRNAs (n = 118) mapping to resolved residues in the structure of active conformation DNMT3A (PDB: 4U7T). sgRNAs are ordered by hierarchical clustering.
b. Boxplot of sgRNA scores in citrine+ cells at day 9 of the base editor scanning experiment, with sgRNAs organized by clusters from a. Data are the average of n = 3 replicates. Dotted lines indicate ±2 SD of intergenic control sgRNAs. Center line, median; box, interquartile range; whiskers, up to 1.5 × interquartile range per the Tukey method. Individual data points are overlaid.
c. View of the DNMT3A homodimer with residues targeted by sgRNAs in clusters 3 and 4 highlighted (PDB: 4U7T).
d. Comparison of PWES values calculated using active conformation (PDB: 4U7T) 3D proximity versus those using autoinhibited conformation (PDB: 4U7P) 3D proximity, represented as the summed ΔPWES (see Methods for details). sgRNA scores, colors, and dotted lines correspond to those in b.
e. View of the ADD (blue)-MTase (red) interface in the structures of DNMT3A in active (left, PDB: 4U7T) or autoinhibited (right, PDB: 4U7P) conformations. Inset shows the ionic bond mediated by R556 and E907.
f. View of active conformation DNMT3A highlighting residues at the ADD-MTase interface that are mutated in AML (data from COSMIC) (PDB: 4U7T).
g. Activity of purified DNMT3A2. Data are mean ± SD of n = 3 replicates.
h. Stimulation of purified DNMT3A2 by H3K4me0 peptide. Right, fold-change in activity in the presence of H3K4me0 versus in the absence of H3K4me0. Data are mean ± SD of n = 3 replicates. Fold-change errors were propagated from the individual SDs. Results are representative of two independent experiments.
i. Cartoon depicting impaired H3K4me0 stimulation caused by mutations disrupting the active conformation ADD-MTase interface.
See also Extended Data Figs. 3-5 and Supplementary Data 4.

