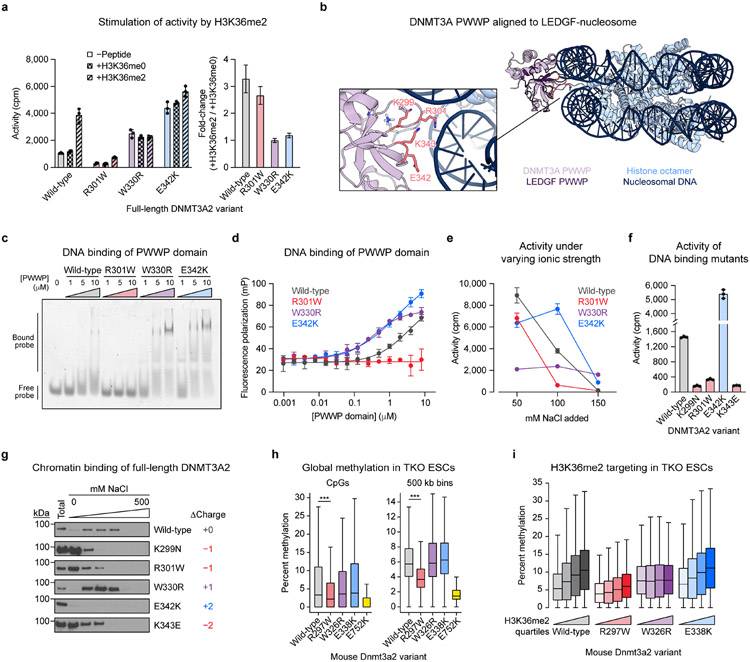
Fig. 5 ∣. DNA binding by the PWWP domain modulates DNMT3A activity.
a. Activity of purified DNMT3A2 in the presence or absence of H3K36 peptide (residues 21–44). Right, calculated fold-change in activity observed with H3K36me2 versus H3K36me0.
b. View of the DNMT3A PWWP domain (PDB: 3LLR) aligned to the structure of the LEDGF-nucleosome complex (PDB: 6S01). Inset shows a close-up of the predicted DNA binding interface (LEDGF not shown in inset).
c–d. Binding of purified PWWP domains to a Cy3-labeled 30 bp oligonucleotide probe measured by (c) electrophoretic mobility shift assay and (d) fluorescence polarization assay.
e. Activity of purified DNMT3A2 under varying ionic strength (see Methods for details).
f. Activity of purified DNMT3A2, comparing effects of mutating residues at the PWWP-DNA interface shown in b.
g. Sequential salt extraction assay showing stepwise elution of FLAG-DNMT3A2 from HEK293T nuclear extracts using increasing concentrations of NaCl. Total refers to total lysate obtained in parallel with benzonase nuclease treatment. Immunoblots were processed in parallel.
h. Genome-wide CpG methylation in TKO ESCs ectopically expressing Dnmt3a2. Left, CpG-level methylation, excluding CpGs with zero methylation in all samples (n = 683,371). Right, methylation averaged across 500 kb bins (n = 5,204). P values (***, P < 2.3 × 10−308) were calculated through two-sided Wilcoxon signed-rank tests.
i. CpG methylation within 10 kb genomic bins ranked into quartiles based on normalized H3K36me2 ChIP-seq signal (n = 23,379 bins per quartile).
Data in a and d–f are mean ± SD for n = 3 replicates. Fold-change errors in a were propagated from the individual SDs. Unprocessed images for c and g are provided as Source Data. Results in a and c–g are representative of two independent experiments. For h and i, only CpGs with 5× coverage across all samples were considered, methylation values represent the average of two biological replicates, and boxplot components are as follows: center line, median; box, interquartile range; whiskers, up to 1.5 × interquartile range per the Tukey method; outliers not shown. See also Extended Data Figs. 4 and 6-9.

