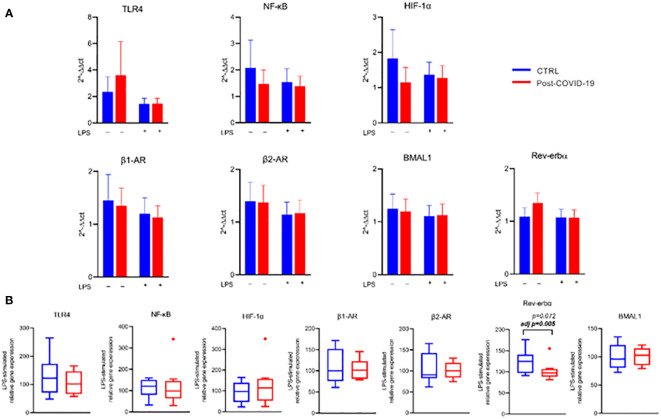
Figure 6.
Gene expression relative to B-tubulin in PBMC stimulated in the absence or presence of LPS [10 ng/mL] between control and post-COVID-19. Values expressed as mean ± SE of (A) TLR-4 expression, NF-κB expression, HIF-1α expression, α1 receptor expression, α2 receptor expression, BMAL1 expression, Rev-Erb-α expression (2−ΔΔct). (B) Respective genes percent changes for both stimulated condition (control n = 8; COVID-19 n = 9). adj p: between- group comparisons were performed using analysis of covariance (ANCOVA) with adjustment for MVPA. p value set < 0.05.

