

Summary
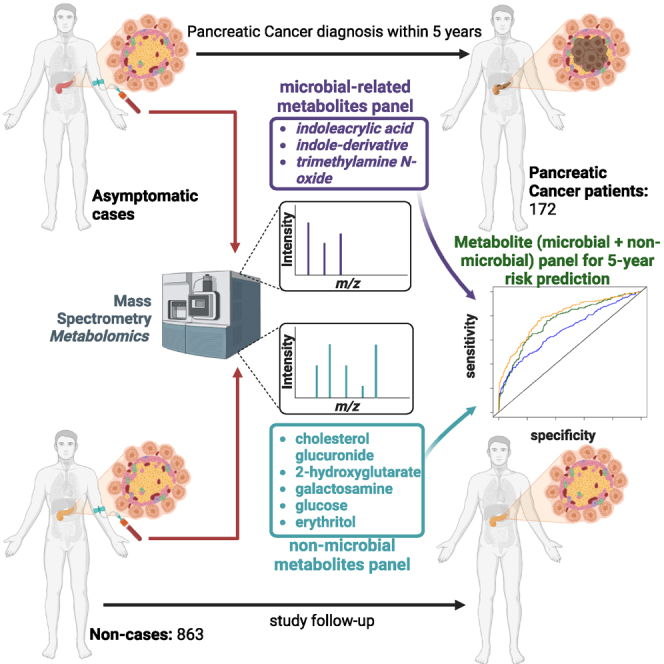
Emerging evidence implicates microbiome involvement in the development of pancreatic cancer (PaCa). Here, we investigate whether increases in circulating microbial-related metabolites associate with PaCa risk by applying metabolomics profiling to 172 sera collected within 5 years prior to PaCa diagnosis and 863 matched non-subject sera from participants in the Prostate, Lung, Colorectal, and Ovarian (PLCO) cohort. We develop a three-marker microbial-related metabolite panel to assess 5-year risk of PaCa. The addition of five non-microbial metabolites further improves 5-year risk prediction of PaCa. The combined metabolite panel complements CA19-9, and individuals with a combined metabolite panel + CA19-9 score in the top 2.5th percentile have absolute 5-year risk estimates of >13%. The risk prediction model based on circulating microbial and non-microbial metabolites provides a potential tool to identify individuals at high risk of PaCa that would benefit from surveillance and/or from potential cancer interception strategies.
Keywords: microbiome, metabolites, biomarker, risk assessment, pancreatic cancer
Graphical abstract
Highlights
-
•
Microbial metabolites in blood inform on risk of developing pancreatic cancer
-
•
A metabolite panel predicts 5-year risk of pancreatic cancer
-
•
The metabolite panel complements CA19-9 for risk prediction of pancreatic cancer
Irajizad et al. report a blood-based metabolite panel that identifies individuals at high risk of developing pancreatic cancer within 5 years of blood draw. The metabolite panel provides a potential tool to identify individuals at high risk of pancreatic cancer who would benefit from surveillance and/or from potential cancer interception strategies.
Introduction
Pancreatic cancer is highly lethal and is projected to become the second leading cause of cancer death in the United States by 2040.1 Surgical resection of localized disease represents the greatest chance for curative therapy. Unfortunately, only a minority (15%–20%) of patients present with surgically resectable disease.2,3
The low incidence of pancreatic cancer in the average-risk population (∼8–12 per 100,000)4,5 makes it challenging to implement effective screening programs for pancreatic cancer. The United States Preventative Services Task Force (USPSTF) currently recommends against screening for pancreatic cancer in the general population using any method.6 Yet, the USPSTF recognizes that screening in persons who are at an increased risk may be warranted.6 There remains an opportunity to develop blood-based signatures that can identify individuals at increased risk who would benefit from screening and, potentially, from preventive interventions.
The microbiota is a complex ecosystem integral to human health. Microbial diversity is site specific and varies depending on the organ location.7 Increasing evidence suggests that alterations in the microbiome are associated with risk for certain cancers, including pancreatic cancer.8 Studies suggest that loss of microbial diversity and community stability coupled with increases in pathogenic microbes increase cancer susceptibility.9 In the context of pancreatic cancer, the composition of the microbiome has been linked to alterations in the local microenvironment and to promotion of oncogenesis through immune suppression,10,11,12 with implications for response to therapy and survival.13
Microbiome colonization has been associated with metabolic changes that can perpetuate inflammation and increase an individual’s risk of developing cancer.7,14,15,16 Microbiome-related metabolites include short-chain fatty acids, butyrate and acetate, secondary bile acids, indole-derivatives, cadaverine, trimethylamine N-oxide (TMAO), and lipopolysaccharides.17 A study of serum methionine-related metabolites identified elevated serum levels of TMAO, a gut microbiota-derived metabolite,18 as associated with pancreatic cancer.19,20 Other metabolites consisting of indoleacrylic acid and indole-3-acetate have been shown to differentiate subjects with newly diagnosed pancreatic cancer from control subjects.21
We designed our study to quantify the extent to which microbiome-related and other metabolites in circulation are elevated among subjects that were subsequently diagnosed with pancreatic cancer using sera collected from participants in the Prostate, Lung, Colorectal, and Ovarian (PLCO) Cancer Screening Trial. Using a training and testing approach, we established a microbial-related metabolite panel for 5-year risk assessment of pancreatic cancer. The performance of the microbiome metabolite panel for risk prediction of pancreatic cancer was further evaluated in an independent cohort of patients with newly-diagnosed pancreatic cancer compared with non-cancer control subjects. The complementary value of other non-microbial-related metabolites as well as CA19-9 was also determined.
Results
Quantification of microbial-related metabolites
Using untargeted metabolomics, we screened for microbial-derived metabolites in sera from 172 subjects diagnosed within 5 years of blood draw and 863 non-subject participants from the PLCO screening trial (Table 1). A total of 14 microbial-related metabolites were detected and quantified across all specimens, including 9 indole derivatives,22,23 two secondary bile acids,24,25 5-hydroxy-tryptophan,26 acetylcadaverine,27 and TMAO.28,29 Of the 14 metabolites, indoleacrylic acid, TMAO, and indole-derivative_2 had adjusted odds ratios (ORs) per unit standard deviation (SD) increase ≥1.2 for risk of pancreatic cancer (Figures S1 and S2). Elevated levels of TMAO and indoleacrylic acid have been associated with phyla of Bacillota, Bacteroidota, Actinomycetota, and Pseudomonadota (species of Clostridium sporogenes [Cs], Eubacterium rectale [Er], Bacteroides thetaiotaomicron [Bt], Parabacteroides distasonis [Pd], Collinsella aerofaciens [Ca], and Edwardsiella tarda [Et]),30 all of which have relevance to pancreatic cancer (Figures 1A and 1B).31,32,33,34
Table 1.
Patient and tumor characteristics for PLCO cohort
| Subject/control subject status |
||||
|---|---|---|---|---|
| Non-subject |
Subject |
|||
| N | % | N | % | |
| Total | 863 | 100 | 173 | 100 |
| Gender | ||||
| Female | 357 | 41.4 | 72 | 41.6 |
| Male | 506 | 58.6 | 101 | 58.4 |
| Age at randomization | ||||
| ≤59 | 183 | 21.2 | 37 | 21.4 |
| 60–64 | 206 | 23.9 | 41 | 23.7 |
| 65–69 | 321 | 37.2 | 64 | 37.0 |
| ≥70 | 153 | 17.7 | 31 | 17.9 |
| Race | ||||
| White | 783 | 90.7 | 157 | 90.8 |
| Black | 30 | 3.5 | 6 | 3.5 |
| Other | 50 | 5.8 | 10 | 5.9 |
| Cigarette smoking status | ||||
| Never smoked cigarettes | 420 | 48.7 | 63 | 36.4 |
| Current cigarette smoker | 74 | 8.6 | 36 | 20.8 |
| Former cigarette smoker | 369 | 42.8 | 74 | 42.8 |
| BMI at baseline (in kg/m2) | ||||
| Not answered | 7 | 0.8 | 0 | 0.0 |
| 0–18.5 | 8 | 0.9 | 3 | 1.7 |
| 18.5–25 | 300 | 34.8 | 56 | 32.4 |
| 25–30 | 365 | 42.3 | 71 | 41.0 |
| 30+ | 183 | 21.2 | 43 | 24.9 |
| Diabetic status | ||||
| Unknown | 1 | 0.1 | 0 | 0.0 |
| Yes | 55 | 6.4 | 22 | 12.7 |
| No | 807 | 93.5 | 151 | 87.3 |
| SEER staging (subjects only) | ||||
| Unknown | – | – | 15 | 8.7 |
| Localized | – | – | 35 | 20.2 |
| Regional | – | – | 33 | 19.1 |
| Distant | – | – | 90 | 52.0 |
Figure 1.

Relationship between TMAO and indoleacrylic acid and microbial species
(A) Association between TMAO and indoleacrlyic acid with different microbial species. Data were derived from the Metabolomics Data Explorer database (see STAR methods).30 Data were derived from N = 2–8 biological replicates.
(B) Association between referenced microbial species and pancreatic cancer.
Model building and testing of microbial-related metabolite panel
To establish a combination rule, all 14 microbial-related metabolites were considered. Seven different models were trained and optimized in the development set (Figure S3; Table S1). LASSO regression with three selected features achieved the highest prediction performance among all models in the validation set, yielding an area under the curve (AUC) of 0.64 (95% confidence interval [CI]: 0.54–0.73) and an adjusted OR of 1.42 (95% CI 0.94–2.13) per unit SD increase for 5-year probability of pancreatic cancer (Tables 2 and S2). To verify the reproducibility of our finding, we adhered to the predictability, computability, and stability (PCS) framework35 and stress tested the 3-marker microbial panel to ensure its reliability. Stable performance in terms of AUC and adjusted OR across various data perturbations and stability checks demonstrated the robustness of the 3-marker microbial panel (Table S3).
Table 2.
Performance of microbial-related metabolites panels in different learning models in the PLCO validation set
| Model | Hyperparameters | AUC (95% CI) | Adj ORa |
|---|---|---|---|
| Logistic regression | – | 0.57 (0.46–0.67) | 1.30 (0.85–2.02) |
| Logistic regression with ridge (L2) regularization | penalty weight = 0.22 | 0.58 (0.48–0.68) | 1.32 (0.87–2.05) |
| Logistic regression with LASSO (L1) regularization | penalty weight = 0.023, number of selected features = 3 | 0.64 (0.54–0.73) | 1.42 (0.94–2.13) |
| Iterative random forest | number of iterations = 4 | 0.52 (0.41–0.62) | 1.28 (0.80–1.77) |
| Deep neural network model | number of cross-validation folds = 4, hidden layers = 2 with 64 nodes in each layer | 0.55 (0.45–0.65) | 1.17 (0.75–1.80) |
| GBM | number of trees = 36, max depth = 6 | 0.53 (0.41–0.65) | 1.12 (0.76–1.58) |
| Auto machine learning (ML) | selected model = randomized trees | 0.57 (0.45–0.68) | 1.04 (0.64–1.63) |
C.I., confidence interval.
Age, gender, BMI, and smoking status were included as covariates in adjusted odds ratios (ORs).
Performance of the 3-marker microbial panel in the test set
In the test set, the 3-marker microbial panel yielded an AUC of 0.64 (95% CI: 0.53–0.76) and an adjusted OR of 1.72 (95% CI: 1.25–2.37) per unit SD increase for 5-year probability of pancreatic cancer (Table 3). When considering subjects diagnosed within 2 years of blood draw, the 3-marker microbial panel yielded an AUC of 0.61 (95% CI: 0.48–0.74) and an adjusted OR of 1.43 (95% CI: 0.98–2.03) per unit SD increase for risk prediction of pancreatic cancer (Table 3). Prediction performance of the 3-marker microbial panel for risk assessment of pancreatic cancer was similar among diabetic and non-diabetic individuals (Table S4).
Table 3.
Performance estimates of the 3-marker microbial panel and a combined 3-marker microbial panel + 5-marker non-microbial panel for 5-year risk prediction of pancreatic cancer in the set-aside test set and the entire PLCO specimen set
| Time to Dx |
Subjects, N |
Non-subjects, N |
AUC (95% CI) |
Adj ORa (95% CI) |
p value |
AUC (95% CI) |
Adj ORa (95% CI) |
p value |
|---|---|---|---|---|---|---|---|---|
| 3-marker microbial panel | 3-marker microbial panel + 5-marker non-microbial panel | |||||||
| Set-aside test set | ||||||||
| [0–5) | 37 | 225 | 0.64 (0.53–0.76) | 1.72 (1.25–2.37) | <0.001 | 0.79 (0.71–0.88) | 3.13 (2.08–4.98) | <0.001 |
| [0–2) | 24 | 225 | 0.61 (0.48–0.74) | 1.43 (0.98–2.03) | 0.04 | 0.82 (0.72–0.93) | 3.80 (2.33–6.74) | <0.001 |
| [2–5) | 13 | 225 | 0.70 (0.50–0.90) | 2.11 (1.33–3.43) | <0.001 | 0.74 (0.60–0.86) | 1.90 (1.08–3.37) | 0.02 |
| Entire set | ||||||||
| [0–5) | 172 | 861 | 0.62 (0.57–0.67) | 1.50 (1.28–1.76) | <0.001 | 0.76 (0.72–0.80) | 2.75 (2.25–3.38) | <0.001 |
| [0–2) | 92 | 861 | 0.60 (0.54–0.67) | 1.43 (1.18–1.74) | <0.001 | 0.81 (0.76–0.86) | 3.66 (2.81–4.84) | <0.001 |
| [2–5) | 80 | 861 | 0.64 (0.57–0.70) | 1.53 (1.28–1.87) | <0.001 | 0.69 (0.63–0.75) | 1.92 (1.51–2.44) | 0.02 |
C.I., confidence interval; Dx, diagnosis.
Age, gender, BMI, and smoking status were included as co-variables in adjusted odd ratios.
We further assessed the prediction performance of the 3-marker microbial panel in an independent set of samples from 99 subjects with newly diagnosed, resectable pancreatic ductal adenocarcinoma (PDAC), 50 patients with chronic pancreatitis (CP), and 100 healthy control subjects (Table S5). Compared to healthy control subjects, the 3-marker microbial panel had an OR of 2.83 (95% CI: 1.83–4.82) per unit SD increase for probability of CP, an OR of 1.55 (95% CI: 1.13–2.23) for pancreatic cancer, and an OR of 2.07 (95% CI: 1.45–3.18) for pancreatic disease (cancer or CP) (Figure S4). Of note, the 3-marker microbial panel performed best for identifying CP, which may be linked with innate pro-inflammatory properties of the microbial metabolites.36,37,38,39
Contributions of non-microbial metabolites for improved risk prediction of pancreatic cancer
We assessed the contribution of non-microbial metabolites for pancreatic cancer risk assessment. A total of 1,009 non-microbial metabolites were quantified in the PLCO specimen set (Table S6). Five non-microbial metabolites (cholesterol glucuronide, 2-hydroxyglutarate, galactosamine, glucose, and erythritol) exhibited statistically significant (p < 0.05) adjusted ORs in the development set (Table S7). We subsequently applied the PCS framework to develop and stress test a model based on the five non-microbial metabolites. A logistic regression model was selected based on exhibiting the highest predictive performance in the validation set, with a resultant AUC of 0.72 (95% CI: 0.65–0.97) and an adjusted OR of 2.10 (95% CI: 1.04–2.80) for 5-year risk prediction of pancreatic cancer (Table S8). In the set-aside test set, the 5-marker non-microbial panel yielded an AUC of 0.74 (95% CI: 0.65–0.83) and an adjusted (adj) OR of 2.72 (95% CI: 1.83–4.24) for 5-year risk prediction of pancreatic cancer (Table S9).
To assess the contributions of the 3-marker microbial panel and the 5-marker non-microbial panel, we fitted a logistic regression with the 3-marker microbial panel scores and the 5-marker non-microbial panel scores as two separate predictors. The combined metabolite panel yielded an AUC of 0.79 (95% CI: 0.71–0.88) and an adj OR of 3.13 (95% CI: 2.08–4.98) per unit SD increase for 5-year probability of pancreatic cancer in the set-aside test set (Tables 3 and S4). When considering subjects diagnosed within 0–2 years and 2–5 years of blood draw, the combined metabolite panel had respective AUCs of 0.82 (95% CI: 0.72–0.93) and 0.74 (95% CI: 0.60–0.86) (Table 3).
Contribution of the combined metabolite panel with CA19-9 for pancreatic cancer risk assessment
We previously demonstrated that levels of CA19-9 were increased in subjects with PDAC in the PLCO cohort, with an exponential rise starting 2 years prior to diagnosis.40 We therefore assessed whether the combined metabolite panel (3-marker microbial panel + the 5-marker non-microbial panel) would be complementary with CA19-9 for risk prediction of pancreatic cancer. In the set-aside test set, the combined metabolite panel + CA19-9 had an AUC of 0.84 (95% CI: 0.76–0.91) and an adj OR of 9.67 (95% CI: 4.56–23.30) per unit SD increase for 5-year probability of pancreatic cancer (Table 4; Figure 2A). For subjects diagnosed within 2 years after blood draw, the combined metabolite panel + CA19-9 yielded an AUC of 0.86 (95% CI: 0.77–0.95), which was markedly improved compared to CA19-9 alone (AUC: 0.70 [0.57–0.82], comparison of AUCs p value: 0.006) (Table 4).
Table 4.
Performance estimates of the CA19-9 and a combined CA19-9 + 3-marker microbial panel + 5-marker non-microbial panel for 5-year risk prediction of pancreatic cancer in the set-aside test set and the entire PLCO specimen set
| Time to Dx |
Numbers |
AUC (95% CI) |
Adj OR (95% CI)a |
p value |
AUC (95% CI) |
Adj OR 95% CI)a |
p value |
Diff. of AUCs (95% CI) |
p value of difference |
Diff. of adj OR (95% CI) |
p value of difference |
|---|---|---|---|---|---|---|---|---|---|---|---|
| CA19-9 | CA19-9 + 3-marker microbial panel + 5-marker non-microbial panel | Difference | |||||||||
|
Set-aside test set | |||||||||||
| [0–5) | N0 = 225N1 = 37 | 0.66 (0.55–0.77) | 2.2 (1.53–3.30) | <0.001 | 0.84 (0.76–0.91) | 9.67 (4.56–23.30) | <0.001 | 0.18 (0.08–0.25) | <0.001 | 7.47 (2.10–15.97) | 0.003 |
| [0–2) | N0 = 225N1 = 24 | 0.70 (0.57–0.82) | 2.55 (1.66–4.19) | <0.001 | 0.86 (0.77–0.95) | 14.99 (5.76–47.66) | <0.001 | 0.16 (0.05–0.29) | 0.006 | 12.44 (2.30–47.40) | 0.01 |
| [2–5) | N0 = 225N1 = 13 | 0.60 (0.40–0.81) | 1.64 (0.94–2.89) | 0.01 | 0.79 (0.67–0.90) | 5.10 (1.93–15.88) | 0.002 | 0.19 (0.02–0.37) | 0.02 | 3.46 (−0.06 to 13.20) | 0.06 |
|
Entire set | |||||||||||
| [0–5) | N0 = 861N1 = 172 | 0.68 (0.63–0.73) | 2.27 (1.89–2.76) | <0.001 | 0.80 (0.75–0.83) | 8.44 (5.80–12.20) | <0.001 | 0.12 (0.07–0.16) | <0.001 | 6.17 (1.80–8.77) | 0.004 |
| [0–2) | N0 = 861N1 = 92 | 0.75 (0.69–0.81) | 3.21 (2.50–4.20) | <0.001 | 0.87 (0.83–0.91) | 20.02 (11.51–36.97) | <0.001 | 0.12 (0.07–0.16) | <0.001 | 16.81 (2.10–27.31) | <0.001 |
| [2–5) | N0 = 861N1 = 80 | 0.60 (0.53–0.67) | 1.48 (1.18–1.87) | <0.001 | 0.71 (0.65–0.77) | 3.52 (2.36–5.32) | <0.001 | 0.11 (0.57–0.70) | 0.001 | 2.04 (1.20–5.86) | 0.04 |
Log transformation of the values were considered for adjusted odds ratio calculation. N0, number of non-subjects; N1, number of subjects.
C.I., confidence interval; Dx, diagnosis.
Age, gender, BMI, and smoking status were included as co-variables in adjusted odd ratios.
Figure 2.

Area under the reciever operating characteristic curves for 5-year risk prediction of pancreatic cancer in the PLCO cohort
Predictive performance estimates for the metabolite (microbial + non-microbial) panel, CA19-9, and the metabolite panel + CA19-9 for 5-year risk prediction of pancreatic cancer in the PLCO set-aside test set (A) and the entire PLCO specimen set (B).
Performance of the combined metabolite panel + CA19-9 for 5-year risk assessment of pancreatic cancer in the entire PLCO specimen set
In the entire PLCO specimen set, the combined metabolite panels + CA19-9 had an AUC of 0.80 (95% CI: 0.75–0.83) and an adj OR of 8.44 (95% CI: 5.80–12.20) for 5-year probability of pancreatic cancer and an AUC of 0.87 (95% CI: 0.83–0.91) with an adj OR of 20.02 (95% CI: 11.51–36.97) per unit SD increase for 2-year probability of pancreatic cancer (Tables 4 and S10; Figure 2B).
5-year absolute risk estimates adjusted for prevalence of disease based on the entire intervention arm of the PLCO population41,42 for individuals with combined metabolite panel + CA19-9 model scores in the 80th, 90th, 95th, and 97.5th percentiles were 1.07%, 2.05%, 4.52%, and 13.33%, respectively (Figure 3).
Figure 3.

Absolute 5-year risk estimates for individuals with CA19-9 + 3-marker microbial panel + 5-marker non-microbial panel scores
Vertical lines represent 20th, 40th, 60th, and 80th percentile values. Table on the bottom provides absolute 5-year risk estimates for individuals with CA19-9, combined metabolite panel (3-marker microbial metabolite panel + 5-marker non-microbial metabolite panel), and the combined metabolite panel + CA19-9 scores.
Discussion
Meaningful reductions in pancreatic cancer-related mortality may be realized through effective screening programs for earlier detection of disease. The low incidence of pancreatic cancer necessitates that a screening test for the general population yields adequate sensitivity at exceptionally high specificity. No such tests yet exist that meet performance criteria necessary for implementation for pancreatic cancer screening in the general population. However, the USPSTF has recognized that high-risk individuals, such as those with inherited risk or individuals with a history of CP, may benefit from surveillance and screening.6 Here, we performed a metabolite screen for reported microbial-related metabolites in the blood and evaluated their association with pancreatic cancer risk. We developed and validated a 3-marker microbial-associated metabolite panel that offers potential utility for identifying individuals at high risk of developing pancreatic cancer within 5 years. A broader metabolite screen resulted in a blood-based metabolite panel consisting of microbial and non-microbial metabolites that yielded further improvements for identifying individuals at high risk of developing pancreatic cancer within 5 years.
Enriching for individuals who are at high risk of pancreatic cancer increases the positive predictive value of pertinent cancer-detection tests while reducing the number of false positive tests. To this end, we showed that the risk prediction model based on circulating microbial + non-microbial metabolites is additive to CA19-9 for identifying individuals who went on to receive a pancreatic cancer diagnosis within 5 years of blood draw. Specifically, our findings demonstrated that individuals with combined metabolite panel + CA19-9 scores in the top 2.5th percentile have estimated 5-year absolute risks of >13%, which would warrant more intensive follow-up and trigger an imaging-based modality such as contrast-enhanced pancreas protocol computed tomography (CT) or MRI/magnetic resonance cholangiopancreatography (MRCP).
The microbial-related metabolite panel includes indoleacyrlic acid, an indole-derivative, and TMAO. TMAO- and indoleacrylic-acid-producing bacteria include those in the phyla of Bacillota, Bacteroidota, Actinomycetota, and Pseudomonadota. Bacillota species such as Cs and Er and Bacteriodota species including Bt and Pd have been shown to be increased in fecal samples of patients with PDAC compared with control subjects.31,32,33 Relative abundances of fecal Collinsella aeofaciens, a species of Actinomycetota, is associated with poor prognosis in PDAC.32
Indole and associated derivatives are derived through the catabolism of tryptophan via the microbiome that may serve as ligands for the aryl hydrocarbon receptor (AHR) to modulate the immune and inflammatory response.43,44,45 Notably, indole and indole derivatives are thought to be largely derived from commensal microbes with reported anti-inflammatory properties.46
TMAO is a gut microbiota-derived metabolite of dietary choline, betaine, and L-carnitine that has been reported to be associated with increased risk of several cancer types including pancreatic cancer.23,47,48,49 Prior studies have shown that TMAO is elevated in pancreatic cystic fluid of individuals presenting with high-risk intraductal papillary mucinous neoplasms or pancreatic cancer compared with those harboring non-cancerous cysts.50 Moreover, levels of TMAO in cystic fluid were positively correlated with bacterial clusters corresponding to Enterobacteriacea, Granulicatella, Klebsiella, Stenotrophomonas, Streptococcus, Haemophilus, and Fusobacterium,50 which have previously been reported to be associated with pancreatic cancer.15,51 Mechanistically, studies have shown that TMAO induces activation of inflammatory pathways, including the nuclear factor κB (NF-κB) pathway and the thioredoxin-interactive protein (TXNIP)-NLRP3 inflammasome, resulting in increased oxidative stress, DNA damage, and release of inflammatory cytokines that may potentiate cancer development.36,37,38,39 We observed TMAO to also be particularly elevated in patients presenting with CP, further suggesting a relationship between TMAO, inflammation of pancreas tissues, and pancreatic cancer risk.52,53
Non-microbial metabolites in the metabolite panel included 2-hydroxyglutarate, cholesterol glucuronide, galactosamine, glucose, and erythritol. Production of the oncometabolite 2-hydroxyglutarate is largely associated with mutations in isocitrate dehydrogenase 1 (IDH1) and IDH2, neomorphic enzymes that convert α-ketoglutarate to 2-hydroxyglutarate.54 2-Hydroxyglutarate can also be produced through alternative metabolic pathways with pro-tumoral effects. For instance, recent data also suggest that, under hypoxic conditions, lactate dehydrogenase produces 2-hydroxyglutarate to maintain stemness and facilitate immune evasion in pancreatic cancer.55 Cholesterol glucuronide is a natural metabolite of cholesterol generated in the liver by UDP glucuronyltransferase. Prior studies have shown that elevated levels of cholesterol glucuronide is prognostic for poor survival in patients with pancreatic cancer.56
The onset of diabetes is often a manifestation that precedes diagnosis of pancreatic cancer, and new-onset glucose intolerance is a frequent and characteristic feature of pancreatic cancer.57,58 To this end, in a prior population-based case-control study of 736 pancreatic cancer subjects and 1,875 age- and gender-matched control subjects, 40.2% of subjects with pancreatic cancer had diabetes.58 In another study, 50% of patients with stage I and II pancreatic cancer had diabetes.57,58,59 Thus, elevated levels of glucose and galactosamine, a hexosamine derived from galactose,60 likely reflect an onset of diabetes that temporally occurs with the development of pancreatic cancer. Although prior studies reported that elevations in circulating branched chain amino acids (BCAAs) were associated with increased risk of PDAC,20,61 we did not observe any statistically significant between BCAA levels and PDAC risk in the PLCO cohort.
There are some considerations to our study. Given the low incidence of PDAC in the general population, procurement of pre-diagnostic specimens for biomarker discovery and testing is challenging. In our study, we leveraged pre-diagnostic sera from the multi-institutional PLCO cancer screening trial to test the merits of microbial-associated and other non-microbial metabolites for risk assessment of PDAC. While we acknowledge the limited sample size of subjects with PDAC in the PLCO specimen set, we emphasize rigor in our statistical approach, adhering to the PCS framework for modeling and evaluation of model stability and robustness,35 as well as the use of an independent set of plasmas from patients with newly diagnosed PDAC . Information regarding new-onset diabetes versus long-standing diabetes as well as other clinical measurements, such as HbA1C or weight loss, were not available. Moreover, the frequency of diabetes in the PLCO cohort is also likely to be underestimated. Consequently, we were unable to evaluate the complementarity of the metabolite panel together with other risk models based on patient characteristics62 for risk assessment of pancreatic cancer. 16S sequencing data to assess stool- or tissue-level microbial diversity and composition were not available for analyzed samples, thus preventing direct correlative studies between specific microbial species and the established microbial-related metabolite panel. CP status, fasting status, and food intake for PLCO participants was not available. Fasting status and food and drink uptake were not controlled for in the PLCO cohort, and information was not available. Time-dependent performance estimates were derived based on availability of serum samples at various time points preceding cancer diagnosis from individual patients. Availability of serial samples would allow for the development of longitudinal algorithms for assessment of pancreatic cancer risk. Whether the metabolite panel to inform on risk of other cancer types warrants consideration. Specificity of the metabolite panel for risk of pancreatic cancer can be improved through testing of recognized high-risk populations, including those with inherited risk63,64 or with mucinous cysts of the pancreas65 or individuals older than 50 with new-onset diabetes.57,58
In conclusion, the metabolite panel has the potential to identify individuals at high risk of pancreatic cancer who may benefit from surveillance and/or potential cancer interception strategies such as vaccines. Integration of the panel with other risk models of pancreatic cancer may yield further improvements for risk assessment.
STAR★Methods
Key resources table
| REAGENT or RESOURCE | SOURCE | IDENTIFIER |
|---|---|---|
| Biological samples | ||
| Pre-diagnostic sera from the Prostate Lung Colorectal and Ovarian (PLCO) Cancer Screening Cohort | PLCO Cohort | N/A |
| Plasmas from newly diagnosed resectable PDAC cases, healthy controls, and patients with chronic pancreatitis | Dana-Farber Cancer Institute/Brigham and Women’s Hospital (DFCI/BWH), Beth Israel Deaconess Medical Center (BIDMC), and Columbia University Irving Medical Center (CUIMC). |
N/A |
| Deposited data | ||
| MetaboLights | This paper | https://www.ebi.ac.uk/metabolights/editor/MTBLS7260/descriptors |
| Other | ||
| Acquity™ UPLC BEH amide, 100 Å, 1.7 μm 2.1× 100mm column |
Waters Corporation, Milford, USA |
catalog number: 176001908 |
| Acquity™ UPLC HSS T3, 100 Å, 1.8 μm, 2.1 × 100mm column | Waters Corporation, Milford, USA |
catalog number: 176001132 |
| Ammonium formate (optima LCMS) | ThermoFisher, Waltham, MA, USA |
catalog number: A11550 |
| Formic Acid | Honeywell Fluka, Charlotte, NC, USA |
catalog number: 60-006-17 |
| LCMS Grade Acetonitrile | ThermoFisher, Waltham, MA, USA |
catalog number: A955-4 |
| LCMS Grade Methanol | ThermoFisher, Waltham, MA, USA |
catalog number: A456-4 |
| LCMS Grade Isopropanol | ThermoFisher, Waltham, MA, USA |
catalog number: A461-4 |
| Metabolomics Data Explorer database | https://sonnenburglab.github.io/Metabolomics_Data_Explorer/#/invivo | N/A |
Resource availability
Lead contact
Further information and requests for resources and reagents should be direct to and will be fulfilled by the lead contact, Johannes F. Fahrmann, Ph.D. (jffahrmann@mdanderson.org).
Materials availability
-
•
This study did not generate new reagents.
-
•
There are restrictions to the availability of human biospecimens due to existing MTA.
Experimental model and study participant details
PLCO cohort
The PLCO Cancer Screening Trial is a randomized multicenter trial in the United States that aimed to evaluate the impact of early detection procedures for prostate, lung, colorectal and ovarian cancer on disease-specific mortality. All subjects involved in this study were enrolled with written consent as a criterion for eligibility to participate in the PLCO trial. Detailed information regarding the PLCO cohort is provided elsewhere.66,67
The study included 173 pancreatic cancer cases that were diagnosed within 5 years of blood draw and 863 matched non-cases from 10 participating PLCO study centers (Table 1). Pancreatic cancer cases were identified by self-report in annual mail-in surveys, state cancer registries, death certificates, physician referrals and reports from next of kin for deceased individuals. All medical and pathologic records related to pancreatic cancer diagnosis and supporting documentation were obtained and confirmed by PLCO staff. Pancreatic cancers were classified as localized, regional, distant, or unstaged using the National Cancer Institute Surveillance, Epidemiology, and End Results (SEER) historic staging system. Non-cases, alive at the time when the index case was diagnosed, were matched to cases at a ratio of 5∶1 (non-case:case) based on the distribution of age, race, gender, and calendar date of blood draw in 2-month blocks within the case cohort.
Newly diagnosed pancreatic cancer cohort
An independent test set consisted of plasma samples from 99 patients with resected PDAC, 50 patients with chronic pancreatitis, and 100 healthy controls as previously described (Table S5).67 Patients with pancreatic cancer provided informed written consent to blood collection pretreatment and to clinical data abstraction under DF/HCC (Dana-Farber/Harvard Cancer Center) protocol 12–013. Samples were collected under IRB approved local collection protocols at Dana-Farber Cancer Institute/Brigham and Women’s Hospital (DFCI/BWH), Beth Israel Deaconess Medical Center (BIDMC), and Columbia University Irving Medical Center (CUIMC)). Healthy controls were recruited from DFCI/BWH and CUIMC and consisted of subjects undergoing screening colonoscopy or accompanying a non–blood-related patient to an appointment at a gastrointestinal cancer clinic. Healthy controls had no history of cancer in the 5 years before sample collection. Patients with pancreatic cancer and healthy controls were matched on gender and age at the time of blood collection. Patients with chronic pancreatitis (CP) were recruited from gastroenterology clinics at DFCI/BWH, BIDMC, and CUIMC. Patients were included if clinic notes from a gastroenterologist indicated a diagnosis of CP. Patients with pancreatic cancer or CP were not gender or age matched. Clinical data abstraction was performed identically across the sites with data uploaded to a password-protected REDCap database. All plasma samples were collected and processed according to a uniform, standardized protocol across the sites and patient groups.
Method details
Metabolomic analysis
Sample extraction
Serum and plasma metabolites were extracted from pre-aliquoted biospecimen (15 μL) with 45μL of LCMS grade methanol (ThermoFisher) in a 96-well microplate (Eppendorf). Plates were heat sealed, vortexed for 5 min at 750 rpm, and centrifuged at 2000 × g for 10 min at room temperature. The supernatant (30μL) was carefully transferred to a 96-well plate, leaving behind the precipitated protein. The supernatant was further diluted with 60μL of 100mM ammonium formate, pH3 (Fisher Scientific). For Hydrophilic Interaction Liquid Chromatography (HILIC) positive ion analysis, 15μL of the supernatant and ammonium formate mix were diluted with 195μL of 1:3:8:144 water (GenPure ultrapure water system, Thermofisher): LCMS grade methanol (ThermoFisher): 100mM ammonium formate, pH3 (Fisher Scientific): LCMS grade acetonitrile (ThermoFisher). For C18 analysis, 15μL of the supernatant and ammonium formate mix were diluted with 90μL water (GenPure ultrapure water system, Thermofisher) for positive ion mode. Each sample solution was transferred to 384-well microplate (Eppendorf) for LCMS analysis.
Untargeted metabolomic analyses
Untargeted metabolomics analysis was conducted on Waters Acquity UPLC system with 2D column regeneration configuration (I-class and H-class) coupled to a Xevo G2-XS quadrupole time-of-flight (qTOF) mass spectrometer as previously described.68,69,70,71 Chromatographic separation was performed using HILIC (Acquity UPLC BEH amide, 100 Å, 1.7 μm 2.1 × 100mm, Waters Corporation, Milford, U.S.A) and C18 (Acquity UPLC HSS T3, 100 Å, 1.8 μm, 2.1 × 100mm, Water Corporation, Milford, U.S.A) columns at 45°C.
Quaternary solvent system mobile phases were (A) 0.1% formic acid in water, (B) 0.1% formic acid in acetonitrile and (D) 100mM ammonium formate, pH 3. Samples were separated on the HILIC using the following gradient profile at 0.4 mL/min flow rate: (95% B, 5% D) linear change to (70% A, 25% B and 5% D) over 5 min; 100% A for 1 min; and 100% A for 1 min. For C18 separation, the chromatography gradient was as follows at 0.4 mL/min flow rate: 100% A with a linear change to (5% A, 95% B) over 5 min; (95% B, 5% D) for 1 min; and 1 min at (95% B, 5% D).
A binary pump was used for column regeneration and equilibration. The solvent system mobile phases were (A1) 100mM ammonium formate, pH 3, (A2) 0.1% formic in 2-propanol and (B1) 0.1% formic acid in acetonitrile. The HILIC column was stripped using 90% A2 for 5 min at 0.25 mL/min flow rate, followed by a 2 min equilibration using 100% B1 at 0.3 mL/min flow rate. Reverse phase C18 column regeneration was performed using 95% A1, 5% B1 for 2 min followed by column equilibration using 5% A1, 95% B1 for 5 min at 0.4 mL/min flow rate.
Mass spectrometry data acquisition
Mass spectrometry data was acquired using ‘sensitivity’ mode in positive electrospray ionization mode within 50–800 Da range. For the electrospray acquisition, the capillary voltage was set at 1.5 kV (positive), sample cone voltage 30V, source temperature at 120°C, cone gas flow 50 L/h and desolvation gas flow rate of 800 L/h with scan time of 0.5 s in continuum mode. Leucine Enkephalin; 556.2771 Da (positive) was used for lockspray correction and scans were performed at 0.5s. The injection volume for each sample was 6 μL. The acquisition was carried out with instrument auto gain control to optimize instrument sensitivity over the samples acquisition time.
Data processing
LC-MS and LC-MSe data were processed using Progenesis QI (Nonlinear, Waters). Peak picking and retention time alignment of LC-MS and MSe data were performed using Progenesis QI software (Nonlinear, Waters). Data processing and peak annotations were performed using an in-house automated pipeline as previously described.68,69,70,72 Annotations were determined by matching accurate mass and retention times using customized libraries created from authentic standards and by matching experimental tandem mass spectrometry data against the NIST MSMS, LipidBlast or HMDB v3 theoretical fragmentations. To correct for injection order drift, each feature was normalized using data from repeat injections of quality control samples collected every 10 injections throughout the run sequence. Measurement data were smoothed by Locally Weighted Scatterplot Smoothing (LOESS) signal correction (QC-RLSC) as previously described. Values are reported as ratios relative to the median of historical quality control reference samples run with every analytical batch for the given analyte.68,69,70,72
Quantification and statistical analysis
Statistical analysis
Predictive performance estimates for individual microbial-related metabolites identified and quantified through metabolomic profiling of sera were assessed using receiver operating characteristic curve (ROC). Time-dependent ROC analyses were performed using pROC (version 1.15.3) in the R software environment (version 3.6.1, The R Foundation, https://www.r-project.org). The 95% confidence intervals (CI) for AUCs were estimated using the Delong method.73 Corresponding 95% confidence intervals for odds ratios, adjusted odds ratios, specificity, sensitivity and the difference measurements were calculated using 1,000 bootstrap samples. Age, gender, BMI, and smoking status were included as covariates in the adjusted odds ratio.
Throughout the statistical analysis, we adhered to the PCS (Predictability, Computability and Stability) framework for veridical (trustworthy) data science,35 which has proven valuable in many previous scientific discoveries including novel gene-gene interaction for the red-hair phenotype,74 clinically-relevant subgroups in a randomized drug trial,75 and interpretable drug response prediction.76 For the modeling stage as in this paper, the PCS framework uses predictability as a reality check, and for reproducibility, it advocates for a stability analysis across different reasonable perturbations of the data and models that pass the prediction check. Under this framework, the entire PLCO specimen set was divided into (1) a Development Set that was used for training and tuning the models (Training Set) and model selection (Validation Set) and (2) a set-aside Test Set for obtaining an unbiased evaluation of the selected final model (Figure 2; Table S1). The Development Set consisted of case and non-case sera from seven of the ten PLCO study centers; the set-aside Test Set consisted of case and non-case sera from the remaining three PLCO study centers.
Seven different learning algorithms were evaluated including a deep learning model (fully-connected feedforward network), gradient boosting machine, auto-machine learning, iterative random forest, logistic regression with LASSO (L1) regularization, logistic regression with ridge (L2) regularization, and logistic regression models. Deep neural network, extreme gradient boosting, and auto machine learning algorithms were performed using the h2o package in R.77 Iterative random forest was run using the iRF package in R.78 To further evaluate model stability in accordance with PCS framework, data perturbations (e.g., via random selection and replacement) were introduced to the Development Set and the performance re-assessed. Based on AUC, a LASSO regression model with 3 selected microbial-associate metabolites (an indole-derivative, TMAO, and indoleacrylic acid) that showed the highest and most stable predictive performance was selected for subsequent testing in the set-aside Test Set as well as the independent newly diagnosed PDAC cohort.
To select the non-microbiome metabolites, the adjusted odds ratio and corresponding p value for each feature were calculated and corrected using Benjamini-Hochberg in the training set in which 12 metabolites showed an adjusted odds ratio greater than 1 with adjusted p value less than 0.05. Five out of 12 features yielded significant p values and adjusted odds ratio greater than 1 in the Validation Set. The prediction performance of the combined five non-microbiome features trained in the training set using logistic regression was evaluated against the microbiome metabolite panel and CA19-9 in the testing set.
For the combination of 3-marker microbial-related metabolite panel, non-microbiome metabolite panel and CA19-9, we fit a logistic regression with three separate predictors, one corresponding to each of the aforementioned features. This model was developed in the Development Set and validated in the set-aside Test Set.
Samples assayed via metabolomics herein reflect a nested case-control cohort that enriches for cases and, therefore, do not reflect the true risk of pancreatic cancer in the general population. In order to determine the 0.5%, 1%, 1.5% and 2% 5-year risk of pancreatic cancer, we thus adjust the estimates to reflect the entire PLCO study population using the approach of Prentice et al.79 In this approach, a prospective logistic model is estimated from the case-control study that includes an offset term to the logistic model. The offset term is the logit of the prevalence in the population minus the logit of the prevalence in the analyzed dataset. Briefly, absolute risk values for each biomarker were estimated by calculating coefficients of a logistic regression in the training set and the intercept adjusted using the following equation:
where
In this equation, is the intercept derived from logistic regression in the nested case-control within a cohort, is the prevalence of the disease in our case-enriched dataset, is the prevalence of the disease in the general population, model represents the predicted score derived from the selected model and is the corresponding coefficient for the model score.
Additional resources
Microbial-associated metabolite database
To evaluate the association between the microbial-associated metabolites identified in the PLCO specimen sets with distinct microbial species, we used the Metabolomics Data Explorer database (https://sonnenburglab.github.io/Metabolomics_Data_Explorer/#/invivo) developed by Shuo Han and colleagues.30 The database reports the metabolic profiles of 178 gut microorganism strains; microbiota-dependent metabolites were established in diverse biological fluids from gnotobiotic and conventionally colonized mice and traced back to the corresponding metabolomic profiles of cultured bacteria.30
Acknowledgments
J.F.F. was supported by the McKee Early Career Investigator in Pancreatic Cancer Research. B.M.W. was supported by NIH grant U01 CA210171, the Hale Family Center for Pancreatic Cancer Research, the Lustgarten Foundation Dedicated Laboratory program, Stand Up To Cancer, NIH grant P50 CA127003, the Pancreatic Cancer Action Network, the Noble Effort Fund, the Wexler Family Fund, and Promises for Purple. The funding specific to sample collection and management for this cohort was NIH grant U01 CA210171. Work was supported by generous philanthropic contributions to The University of Texas MD Anderson Cancer Center Moon Shots Program TM. A.M. and S.H. are supported by MCL (5U01CA196403-05), EDRN (5U01CA200468-05), and the MD Anderson Cancer Center GI SPORE (5-P50-CA221707-02). J.P.L. is supported by EDRN (5U01CA200468-05). T.T. was supported by the NSF Graduate Research Fellowship Program DGE-2146752. A.K. and B.Y. were supported by a Chan Zuckerberg Biohub Intercampus Research Award. B.Y. was also supported by NSF DMS-1613002, IIS 1741340, and a Weill Neurohub grant.
Author contributions
Conceptualization, E.I., S.H., and J.F.F.; methodology, E.I., B.Y., R.W., E.M., J.B.D., and J.F.F.; formal analysis, E.I., A.K., T.T., B.Y., and J.F.F.; investigation, E.I. and J.F.F.; resources, J.A.C., M.D.K., F.K., L.B., K.J., L.S.L., T.E.C., K.N., A.B., A.M., B.M.W., and S.H.; data curation, E.I., R.W., E.M., and J.F.F.; writing – original draft preparation, E.I. and J.F.F.; writing – review & editing, A.K., T.T., J.V., R.W., E.M., J.B.D., M.S., J.P.L., M.L., J.A.C., M.D.K., F.K., L.B., A.B., K.J., L.S.L., T.E.C., K.N., A.B., J.M.G., A.M., K.-A.D., B.Y., B.M.W., and S.H.; visualization, E.I. and J.F.F.; supervision, S.H. and J.F.F.; project administration, S.H. and J.F.F.; funding acquisition, J.P.L., T.T., A.K., B.Y., A.M., B.M.W., S.H., and J.F.F.
Declaration of interests
An invention disclosure report related to findings reported herein has been submitted to the University of Texas. B.M.W. receives research funding from Celgene and Eli Lilly and does consulting for BioLineRx, Celgene, and GRAIL.
Published: September 19, 2023
Footnotes
Supplemental information can be found online at https://doi.org/10.1016/j.xcrm.2023.101194.
Contributor Information
Sam Hanash, Email: shanash@mdanderson.org.
Johannes F. Fahrmann, Email: jffahrmann@mdanderson.org.
Supplemental information
Data and code availability
-
•
Relevant data supporting the findings of this study are available within the Article and Supplemental Materials.
-
•
No new code was generated for this study.
-
•
Any additional information required to reanalyze the data reported in this paper is available from the lead contact upon request.
References
- 1.Rahib L., Wehner M.R., Matrisian L.M., Nead K.T. Estimated Projection of US Cancer Incidence and Death to 2040. JAMA Netw. Open. 2021;4:e214708. doi: 10.1001/jamanetworkopen.2021.4708. [DOI] [PMC free article] [PubMed] [Google Scholar]
- 2.Ryan D.P., Hong T.S., Bardeesy N. Pancreatic adenocarcinoma. N. Engl. J. Med. 2014;371:1039–1049. doi: 10.1056/NEJMra1404198. [DOI] [PubMed] [Google Scholar]
- 3.Kleeff J., Korc M., Apte M., La Vecchia C., Johnson C.D., Biankin A.V., Neale R.E., Tempero M., Tuveson D.A., Hruban R.H., Neoptolemos J.P. Pancreatic cancer. Nat. Rev. Dis. Prim. 2016;2 doi: 10.1038/nrdp.2016.22. [DOI] [PubMed] [Google Scholar]
- 4.Bray F., Ferlay J., Soerjomataram I., Siegel R.L., Torre L.A., Jemal A. Global cancer statistics 2018: GLOBOCAN estimates of incidence and mortality worldwide for 36 cancers in 185 countries. CA A Cancer J. Clin. 2018;68:394–424. doi: 10.3322/caac.21492. [DOI] [PubMed] [Google Scholar]
- 5.Rawla P., Sunkara T., Gaduputi V. Epidemiology of Pancreatic Cancer: Global Trends, Etiology and Risk Factors. World J. Oncol. 2019;10:10–27. doi: 10.14740/wjon1166. [DOI] [PMC free article] [PubMed] [Google Scholar]
- 6.US Preventive Services Task Force. Owens D.K., Davidson K.W., Krist A.H., Barry M.J., Cabana M., Caughey A.B., Curry S.J., Doubeni C.A., Epling J.W., Jr., et al. Screening for Pancreatic Cancer: US Preventive Services Task Force Reaffirmation Recommendation Statement. JAMA. 2019;322:438–444. doi: 10.1001/jama.2019.10232. [DOI] [PubMed] [Google Scholar]
- 7.Human Microbiome Project Consortium Structure, function and diversity of the healthy human microbiome. nature. 2012;486:207–214. doi: 10.1038/nature11234. [DOI] [PMC free article] [PubMed] [Google Scholar]
- 8.Huybrechts I., Zouiouich S., Loobuyck A., Vandenbulcke Z., Vogtmann E., Pisanu S., Iguacel I., Scalbert A., Indave I., Smelov V., et al. The Human Microbiome in Relation to Cancer Risk: A Systematic Review of Epidemiologic Studies. Cancer Epidemiol. Biomarkers Prev. 2020;29:1856–1868. doi: 10.1158/1055-9965.Epi-20-0288. [DOI] [PMC free article] [PubMed] [Google Scholar]
- 9.Bhatt A.P., Redinbo M.R., Bultman S.J. The role of the microbiome in cancer development and therapy. CA A Cancer J. Clin. 2017;67:326–344. doi: 10.3322/caac.21398. [DOI] [PMC free article] [PubMed] [Google Scholar]
- 10.Pushalkar S., Hundeyin M., Daley D., Zambirinis C.P., Kurz E., Mishra A., Mohan N., Aykut B., Usyk M., Torres L.E., et al. The pancreatic cancer microbiome promotes oncogenesis by induction of innate and adaptive immune suppression. Cancer Discov. 2018;8:403–416. doi: 10.1158/2159-8290.CD-17-1134. [DOI] [PMC free article] [PubMed] [Google Scholar]
- 11.Riquelme E., Zhang Y., Zhang L., Montiel M., Zoltan M., Dong W., Quesada P., Sahin I., Chandra V., San Lucas A., et al. Tumor microbiome diversity and composition influence pancreatic cancer outcomes. Cell. 2019;178:795–806.e12. doi: 10.1016/j.cell.2019.07.008. [DOI] [PMC free article] [PubMed] [Google Scholar]
- 12.Barbour S.E., Nakashima K., Zhang J.-B., Tangada S., Hahn C.-L., Schenkein H.A., Tew J.G. Tobacco and smoking: environmental factors that modify the host response (immune system) and have an impact on periodontal health. Crit. Rev. Oral Biol. Med. 1997;8:437–460. doi: 10.1177/10454411970080040501. [DOI] [PubMed] [Google Scholar]
- 13.Zhang X., Liu Q., Liao Q., Zhao Y. Pancreatic Cancer, Gut Microbiota, and Therapeutic Efficacy. J. Cancer. 2020;11:2749–2758. doi: 10.7150/jca.37445. [DOI] [PMC free article] [PubMed] [Google Scholar]
- 14.Risch H.A. Pancreatic cancer: Helicobacter pylori colonization, N-Nitrosamine exposures, and ABO blood group. Mol. Carcinog. 2012;51:109–118. doi: 10.1002/mc.20826. [DOI] [PubMed] [Google Scholar]
- 15.Wei M.-Y., Shi S., Liang C., Meng Q.-C., Hua J., Zhang Y.-Y., Liu J., Zhang B., Xu J., Yu X.-J. The microbiota and microbiome in pancreatic cancer: more influential than expected. Mol. Cancer. 2019;18 doi: 10.1186/s12943-019-1008-0. 97–15. [DOI] [PMC free article] [PubMed] [Google Scholar]
- 16.Brennan C.A., Garrett W.S. Gut Microbiota, Inflammation, and Colorectal Cancer. Annu. Rev. Microbiol. 2016;70:395–411. doi: 10.1146/annurev-micro-102215-095513. [DOI] [PMC free article] [PubMed] [Google Scholar]
- 17.Kiss B., Mikó E., Sebő É., Toth J., Ujlaki G., Szabó J., Uray K., Bai P., Árkosy P. Oncobiosis and Microbial Metabolite Signaling in Pancreatic Adenocarcinoma. Cancers. 2020;12 doi: 10.3390/cancers12051068. [DOI] [PMC free article] [PubMed] [Google Scholar]
- 18.Yang S., Li X., Yang F., Zhao R., Pan X., Liang J., Tian L., Li X., Liu L., Xing Y., Wu M. Gut Microbiota-Dependent Marker TMAO in Promoting Cardiovascular Disease: Inflammation Mechanism, Clinical Prognostic, and Potential as a Therapeutic Target. Front. Pharmacol. 2019;10:1360. doi: 10.3389/fphar.2019.01360. [DOI] [PMC free article] [PubMed] [Google Scholar]
- 19.Huang J.Y., Luu H.N., Butler L.M., Midttun Ø., Ulvik A., Wang R., Jin A., Gao Y.-T., Tan Y., Ueland P.M., et al. A prospective evaluation of serum methionine-related metabolites in relation to pancreatic cancer risk in two prospective cohort studies. Int. J. Cancer. 2020;147:1917–1927. doi: 10.1002/ijc.32994. [DOI] [PMC free article] [PubMed] [Google Scholar]
- 20.Mayers J.R., Wu C., Clish C.B., Kraft P., Torrence M.E., Fiske B.P., Yuan C., Bao Y., Townsend M.K., Tworoger S.S., et al. Elevation of circulating branched-chain amino acids is an early event in human pancreatic adenocarcinoma development. Nat. Med. 2014;20:1193–1198. doi: 10.1038/nm.3686. [DOI] [PMC free article] [PubMed] [Google Scholar]
- 21.Xie G., Lu L., Qiu Y., Ni Q., Zhang W., Gao Y.T., Risch H.A., Yu H., Jia W. Plasma metabolite biomarkers for the detection of pancreatic cancer. J. Proteome Res. 2015;14:1195–1202. doi: 10.1021/pr501135f. [DOI] [PMC free article] [PubMed] [Google Scholar]
- 22.Lee J.-H., Lee J. Indole as an intercellular signal in microbial communities. FEMS Microbiol. Rev. 2010;34:426–444. doi: 10.1111/j.1574-6976.2009.00204.x. [DOI] [PubMed] [Google Scholar]
- 23.Jaglin M., Rhimi M., Philippe C., Pons N., Bruneau A., Goustard B., Daugé V., Maguin E., Naudon L., Rabot S. Indole, a signaling molecule produced by the gut microbiota, negatively impacts emotional behaviors in rats. Front. Neurosci. 2018;12:216. doi: 10.3389/fnins.2018.00216. [DOI] [PMC free article] [PubMed] [Google Scholar]
- 24.Ridlon J.M., Kang D.J., Hylemon P.B., Bajaj J.S. Bile acids and the gut microbiome. Curr. Opin. Gastroenterol. 2014;30:332–338. doi: 10.1097/MOG.0000000000000057. [DOI] [PMC free article] [PubMed] [Google Scholar]
- 25.Hylemon P.B., Harris S.C., Ridlon J.M. Metabolism of hydrogen gases and bile acids in the gut microbiome. FEBS Lett. 2018;592:2070–2082. doi: 10.1002/1873-3468.13064. [DOI] [PubMed] [Google Scholar]
- 26.Stoll M.L., Kumar R., Lefkowitz E.J., Cron R.Q., Morrow C.D., Barnes S. Fecal metabolomics in pediatric spondyloarthritis implicate decreased metabolic diversity and altered tryptophan metabolism as pathogenic factors. Gene Immun. 2016;17:400–405. doi: 10.1038/gene.2016.38. [DOI] [PMC free article] [PubMed] [Google Scholar]
- 27.Pugin B., Barcik W., Westermann P., Heider A., Wawrzyniak M., Hellings P., Akdis C.A., O'Mahony L. A wide diversity of bacteria from the human gut produces and degrades biogenic amines. Microb. Ecol. Health Dis. 2017;28 doi: 10.1080/16512235.2017.1353881. [DOI] [PMC free article] [PubMed] [Google Scholar]
- 28.Brunt V.E., LaRocca T.J., Bazzoni A.E., Sapinsley Z.J., Miyamoto-Ditmon J., Gioscia-Ryan R.A., Neilson A.P., Link C.D., Seals D.R. The gut microbiome–derived metabolite trimethylamine N-oxide modulates neuroinflammation and cognitive function with aging. GeroScience. 2021;43:377–394. doi: 10.1007/s11357-020-00257-2. [DOI] [PMC free article] [PubMed] [Google Scholar]
- 29.Xu R., Wang Q., Li L. A genome-wide systems analysis reveals strong link between colorectal cancer and trimethylamine N-oxide (TMAO), a gut microbial metabolite of dietary meat and fat. BMC Genom. 2015;16:S4–S9. doi: 10.1186/1471-2164-16-S7-S4. [DOI] [PMC free article] [PubMed] [Google Scholar]
- 30.Han S., Van Treuren W., Fischer C.R., Merrill B.D., DeFelice B.C., Sanchez J.M., Higginbottom S.K., Guthrie L., Fall L.A., Dodd D., et al. A metabolomics pipeline for the mechanistic interrogation of the gut microbiome. Nature. 2021;595:415–420. doi: 10.1038/s41586-021-03707-9. [DOI] [PMC free article] [PubMed] [Google Scholar]
- 31.Zhou W., Zhang D., Li Z., Jiang H., Li J., Ren R., Gao X., Li J., Wang X., Wang W., Yang Y. The fecal microbiota of patients with pancreatic ductal adenocarcinoma and autoimmune pancreatitis characterized by metagenomic sequencing. J. Transl. Med. 2021;19:215–312. doi: 10.1186/s12967-021-02882-7. [DOI] [PMC free article] [PubMed] [Google Scholar]
- 32.Matsukawa H., Iida N., Kitamura K., Terashima T., Seishima J., Makino I., Kannon T., Hosomichi K., Yamashita T., Sakai Y., et al. Dysbiotic gut microbiota in pancreatic cancer patients form correlation networks with the oral microbiota and prognostic factors. Am. J. Cancer Res. 2021;11:3163–3175. [PMC free article] [PubMed] [Google Scholar]
- 33.Half E., Keren N., Reshef L., Dorfman T., Lachter I., Kluger Y., Reshef N., Knobler H., Maor Y., Stein A., et al. Fecal microbiome signatures of pancreatic cancer patients. Sci. Rep. 2019;9:16801–16812. doi: 10.1038/s41598-019-53041-4. [DOI] [PMC free article] [PubMed] [Google Scholar]
- 34.Kamiyama S., Kuriyama A., Hashimoto T. Edwardsiella tarda Bacteremia, Okayama, Japan, 2005–2016. Emerg. Infect. Dis. 2019;25:1817–1823. doi: 10.3201/eid2510.180518. [DOI] [PMC free article] [PubMed] [Google Scholar]
- 35.Yu B., Kumbier K. Veridical data science. Proc. Natl. Acad. Sci. USA. 2020;117:3920–3929. doi: 10.1073/pnas.1901326117. [DOI] [PMC free article] [PubMed] [Google Scholar]
- 36.Sun X., Jiao X., Ma Y., Liu Y., Zhang L., He Y., Chen Y. Trimethylamine N-oxide induces inflammation and endothelial dysfunction in human umbilical vein endothelial cells via activating ROS-TXNIP-NLRP3 inflammasome. Biochem. Biophys. Res. Commun. 2016;481:63–70. doi: 10.1016/j.bbrc.2016.11.017. [DOI] [PubMed] [Google Scholar]
- 37.Seldin M.M., Meng Y., Qi H., Zhu W., Wang Z., Hazen S.L., Lusis A.J., Shih D.M. Trimethylamine N-Oxide Promotes Vascular Inflammation Through Signaling of Mitogen-Activated Protein Kinase and Nuclear Factor-κB. J. Am. Heart Assoc. 2016;5 doi: 10.1161/jaha.115.002767. [DOI] [PMC free article] [PubMed] [Google Scholar]
- 38.Arlt A., Schäfer H., Kalthoff H. The ‘N-factors’ in pancreatic cancer: functional relevance of NF-κB, NFAT and Nrf2 in pancreatic cancer. Oncogenesis. 2012;1:e35. doi: 10.1038/oncsis.2012.35. [DOI] [PMC free article] [PubMed] [Google Scholar]
- 39.Missiroli S., Perrone M., Boncompagni C., Borghi C., Campagnaro A., Marchetti F., Anania G., Greco P., Fiorica F., Pinton P., Giorgi C. Targeting the NLRP3 Inflammasome as a New Therapeutic Option for Overcoming Cancer. Cancers. 2021;13 doi: 10.3390/cancers13102297. [DOI] [PMC free article] [PubMed] [Google Scholar]
- 40.Fahrmann J.F., Schmidt C.M., Mao X., Irajizad E., Loftus M., Zhang J., Patel N., Vykoukal J., Dennison J.B., Long J.P., et al. Lead-time trajectory of CA19-9 as an anchor marker for pancreatic cancer early detection. Gastroenterology. 2021;160:1373–1383.e6. doi: 10.1053/j.gastro.2020.11.052. [DOI] [PMC free article] [PubMed] [Google Scholar]
- 41.Prorok P.C., Andriole G.L., Bresalier R.S., Buys S.S., Chia D., Crawford E.D., Fogel R., Gelmann E.P., Gilbert F., Hasson M.A., et al. Design of the prostate, lung, colorectal and ovarian (PLCO) cancer screening trial. Contr. Clin. Trials. 2000;21:273S–309S. doi: 10.1016/s0197-2456(00)00098-2. [DOI] [PubMed] [Google Scholar]
- 42.Anderson K.E., Mongin S.J., Sinha R., Stolzenberg-Solomon R., Gross M.D., Ziegler R.G., Mabie J.E., Risch A., Kazin S.S., Church T.R. Pancreatic cancer risk: Associations with meat-derived carcinogen intake in the Prostate, Lung, Colorectal, and Ovarian Cancer Screening Trial (PLCO) cohort. Mol. Carcinog. 2012;51:128–137. doi: 10.1002/mc.20794. [DOI] [PMC free article] [PubMed] [Google Scholar]
- 43.Wlodarska M., Luo C., Kolde R., d’Hennezel E., Annand J.W., Heim C.E., Krastel P., Schmitt E.K., Omar A.S., Creasey E.A., et al. Indoleacrylic acid produced by commensal peptostreptococcus species suppresses inflammation. Cell Host Microbe. 2017;22:25–37.e6. doi: 10.1016/j.chom.2017.06.007. [DOI] [PMC free article] [PubMed] [Google Scholar]
- 44.Hubbard T.D., Murray I.A., Bisson W.H., Lahoti T.S., Gowda K., Amin S.G., Patterson A.D., Perdew G.H. Adaptation of the human aryl hydrocarbon receptor to sense microbiota-derived indoles. Sci. Rep. 2015;5 doi: 10.1038/srep12689. [DOI] [PMC free article] [PubMed] [Google Scholar]
- 45.Hezaveh K., Shinde R.S., Klötgen A., Halaby M.J., Lamorte S., Ciudad M.T., Quevedo R., Neufeld L., Liu Z.Q., Jin R., et al. Tryptophan-derived microbial metabolites activate the aryl hydrocarbon receptor in tumor-associated macrophages to suppress anti-tumor immunity. Immunity. 2022;55:324–340.e8. doi: 10.1016/j.immuni.2022.01.006. [DOI] [PMC free article] [PubMed] [Google Scholar]
- 46.Roager H.M., Licht T.R. Microbial tryptophan catabolites in health and disease. Nat. Commun. 2018;9:3294. doi: 10.1038/s41467-018-05470-4. [DOI] [PMC free article] [PubMed] [Google Scholar]
- 47.Huang J.Y., Luu H.N., Butler L.M., Midttun Ø., Ulvik A., Wang R., Jin A., Gao Y.T., Tan Y., Ueland P.M., et al. A prospective evaluation of serum methionine-related metabolites in relation to pancreatic cancer risk in two prospective cohort studies. Int. J. Cancer. 2020;147:1917–1927. doi: 10.1002/ijc.32994. [DOI] [PMC free article] [PubMed] [Google Scholar]
- 48.Jiao L., Maity S., Coarfa C., Rajapakshe K., Chen L., Jin F., Putluri V., Tinker L.F., Mo Q., Chen F., et al. A prospective targeted serum metabolomics study of pancreatic cancer in postmenopausal women. Cancer Prev. Res. 2019;12:237–246. doi: 10.1158/1940-6207.CAPR-18-0201. [DOI] [PMC free article] [PubMed] [Google Scholar]
- 49.Huang J., Butler L., Midttun Ø., Wang R., Jin A., Gao Y.-T., Ueland P., Koh W.-P., Yuan J.-M. AACR; 2017. Serum Choline, Methionine, Betaine, Dimethylglycine, and Trimethylamine-N-Oxide in Relation to Pancreatic Cancer Risk in Two Nested Case-Control Studies in Asian Populations. [Google Scholar]
- 50.Morgell A., Reisz J.A., Ateeb Z., Davanian H., Reinsbach S.E., Halimi A., Gaiser R., Valente R., Arnelo U., Del Chiaro M., et al. Metabolic Characterization of Plasma and Cyst Fluid from Cystic Precursors to Pancreatic Cancer Patients Reveal Metabolic Signatures of Bacterial Infection. J. Proteome Res. 2021;20:2725–2738. doi: 10.1021/acs.jproteome.1c00018. [DOI] [PubMed] [Google Scholar]
- 51.Rogers M.B., Aveson V., Firek B., Yeh A., Brooks B., Brower-Sinning R., Steve J., Banfield J.F., Zureikat A., Hogg M., et al. Disturbances of the Perioperative Microbiome Across Multiple Body Sites in Patients Undergoing Pancreaticoduodenectomy. Pancreas. 2017;46:260–267. doi: 10.1097/mpa.0000000000000726. [DOI] [PMC free article] [PubMed] [Google Scholar]
- 52.Whitcomb D.C. Inflammation and Cancer V. Chronic pancreatitis and pancreatic cancer. Am. J. Physiol. Gastrointest. Liver Physiol. 2004;287:G315–G319. doi: 10.1152/ajpgi.00115.2004. [DOI] [PubMed] [Google Scholar]
- 53.Farrow B., Evers B.M. Inflammation and the development of pancreatic cancer. Surg. Oncol. 2002;10:153–169. doi: 10.1016/s0960-7404(02)00015-4. [DOI] [PubMed] [Google Scholar]
- 54.Dang L., White D.W., Gross S., Bennett B.D., Bittinger M.A., Driggers E.M., Fantin V.R., Jang H.G., Jin S., Keenan M.C., et al. Cancer-associated IDH1 mutations produce 2-hydroxyglutarate. Nature. 2009;462:739–744. doi: 10.1038/nature08617. [DOI] [PMC free article] [PubMed] [Google Scholar]
- 55.Gupta V.K., Sharma N.S., Durden B., Garrido V.T., Kesh K., Edwards D., Wang D., Myer C., Mateo-Victoriano B., Kollala S.S., et al. Hypoxia-Driven Oncometabolite L-2HG Maintains Stemness-Differentiation Balance and Facilitates Immune Evasion in Pancreatic Cancer. Cancer Res. 2021;81:4001–4013. doi: 10.1158/0008-5472.Can-20-2562. [DOI] [PMC free article] [PubMed] [Google Scholar]
- 56.Chen K., Zhou C., He Y., Liu J., Yang X. Metabolomics Profiling of EUS-FNA Sample Predicts Advanced Pancreatic Adenocarcinoma Prognosis. Research Square. 2021 [Google Scholar]
- 57.Sharma A., Kandlakunta H., Nagpal S.J.S., Feng Z., Hoos W., Petersen G.M., Chari S.T. Model to Determine Risk of Pancreatic Cancer in Patients With New-Onset Diabetes. Gastroenterology. 2018;155:730–739.e3. doi: 10.1053/j.gastro.2018.05.023. [DOI] [PMC free article] [PubMed] [Google Scholar]
- 58.Pannala R., Basu A., Petersen G.M., Chari S.T. New-onset diabetes: a potential clue to the early diagnosis of pancreatic cancer. Lancet Oncol. 2009;10:88–95. doi: 10.1016/s1470-2045(08)70337-1. [DOI] [PMC free article] [PubMed] [Google Scholar]
- 59.Pannala R., Leirness J.B., Bamlet W.R., Basu A., Petersen G.M., Chari S.T. Prevalence and clinical profile of pancreatic cancer-associated diabetes mellitus. Gastroenterology. 2008;134:981–987. doi: 10.1053/j.gastro.2008.01.039. [DOI] [PMC free article] [PubMed] [Google Scholar]
- 60.Theocharis A.D., Tsara M.E., Papageorgacopoulou N., Karavias D.D., Theocharis D.A. Pancreatic carcinoma is characterized by elevated content of hyaluronan and chondroitin sulfate with altered disaccharide composition. Biochim. Biophys. Acta. 2000;1502:201–206. doi: 10.1016/S0925-4439(00)00051-X. [DOI] [PubMed] [Google Scholar]
- 61.Katagiri R., Goto A., Nakagawa T., Nishiumi S., Kobayashi T., Hidaka A., Budhathoki S., Yamaji T., Sawada N., Shimazu T., et al. Increased Levels of Branched-Chain Amino Acid Associated With Increased Risk of Pancreatic Cancer in a Prospective Case-Control Study of a Large Cohort. Gastroenterology. 2018;155:1474–1482.e1. doi: 10.1053/j.gastro.2018.07.033. [DOI] [PubMed] [Google Scholar]
- 62.Yuan C., Babic A., Khalaf N., Nowak J.A., Brais L.K., Rubinson D.A., Ng K., Aguirre A.J., Pandharipande P.V., Fuchs C.S., et al. Diabetes, Weight Change, and Pancreatic Cancer Risk. JAMA Oncol. 2020;6 doi: 10.1001/jamaoncol.2020.2948. [DOI] [PMC free article] [PubMed] [Google Scholar]
- 63.Canto M.I., Almario J.A., Schulick R.D., Yeo C.J., Klein A., Blackford A., Shin E.J., Sanyal A., Yenokyan G., Lennon A.M., et al. Risk of Neoplastic Progression in Individuals at High Risk for Pancreatic Cancer Undergoing Long-term Surveillance. Gastroenterology. 2018;155:740–751.e2. doi: 10.1053/j.gastro.2018.05.035. [DOI] [PMC free article] [PubMed] [Google Scholar]
- 64.Petersen G.M. Familial pancreatic cancer. Semin. Oncol. 2016;43:548–553. doi: 10.1053/j.seminoncol.2016.09.002. [DOI] [PMC free article] [PubMed] [Google Scholar]
- 65.Ohno E., Hirooka Y., Kawashima H., Ishikawa T., Kanamori A., Ishikawa H., Sasaki Y., Nonogaki K., Hara K., Hashimoto S., et al. Natural history of pancreatic cystic lesions: A multicenter prospective observational study for evaluating the risk of pancreatic cancer. J. Gastroenterol. Hepatol. 2018;33:320–328. doi: 10.1111/jgh.13967. [DOI] [PubMed] [Google Scholar]
- 66.Prorok P.C., Andriole G.L., Bresalier R.S., Buys S.S., Chia D., Crawford E.D., Fogel R., Gelmann E.P., Gilbert F., Hasson M.A., et al. Design of the Prostate, Lung, Colorectal and Ovarian (PLCO) Cancer Screening Trial. Contr. Clin. Trials. 2000;21:273s–309s. doi: 10.1016/s0197-2456(00)00098-2. [DOI] [PubMed] [Google Scholar]
- 67.Fahrmann J.F., Schmidt C.M., Mao X., Irajizad E., Loftus M., Zhang J., Patel N., Vykoukal J., Dennison J.B., et al. Lead-Time Trajectory of CA19-9 as an Anchor Marker for Pancreatic Cancer Early Detection. Gastroenterology. 2021;160:1373–1383.e6. doi: 10.1053/j.gastro.2020.11.052. [DOI] [PMC free article] [PubMed] [Google Scholar]
- 68.Fahrmann J.F., Bantis L.E., Capello M., Scelo G., Dennison J.B., Patel N., Murage E., Vykoukal J., Kundnani D.L., Foretova L., et al. A Plasma-Derived Protein-Metabolite Multiplexed Panel for Early-Stage Pancreatic Cancer. J. Natl. Cancer Inst. 2019;111:372–379. doi: 10.1093/jnci/djy126. [DOI] [PMC free article] [PubMed] [Google Scholar]
- 69.Fahrmann J.F., Irajizad E., Kobayashi M., Vykoukal J., Dennison J.B., Murage E., Wu R., Long J.P., Do K.A., Celestino J., et al. A MYC-Driven Plasma Polyamine Signature for Early Detection of Ovarian Cancer. Cancers. 2021;13 doi: 10.3390/cancers13040913. [DOI] [PMC free article] [PubMed] [Google Scholar]
- 70.Fahrmann J.F., Vykoukal J., Fleury A., Tripathi S., Dennison J.B., Murage E., Wang P., Yu C.Y., Capello M., Creighton C.J., et al. Association Between Plasma Diacetylspermine and Tumor Spermine Synthase With Outcome in Triple-Negative Breast Cancer. J. Natl. Cancer Inst. 2020;112:607–616. doi: 10.1093/jnci/djz182. [DOI] [PMC free article] [PubMed] [Google Scholar]
- 71.Johannes F., Carla P., Amanda W. 2021. A Blood-Based Polyamine Signature Associated with MEN1 Duodenopancreatic Neuroendocrine Tumor Progression 10.6084/m9.figshare.14639079.V1. [DOI] [PMC free article] [PubMed] [Google Scholar]
- 72.Vykoukal J., Fahrmann J.F., Gregg J.R., Tang Z., Basourakos S., Irajizad E., Park S., Yang G., Creighton C.J., Fleury A., et al. Caveolin-1-mediated sphingolipid oncometabolism underlies a metabolic vulnerability of prostate cancer. Nat. Commun. 2020;11:4279. doi: 10.1038/s41467-020-17645-z. [DOI] [PMC free article] [PubMed] [Google Scholar]
- 73.DeLong E.R., DeLong D.M., Clarke-Pearson D.L. Comparing the areas under two or more correlated receiver operating characteristic curves: a nonparametric approach. Biometrics. 1988;44:837–845. [PubMed] [Google Scholar]
- 74.Behr M., Kumbier K., Cordova-Palomera A., Aguirre M., Ashley E., Butte A.J., Arnaout R., Brown B., Priest J., Yu B. Learning epistatic polygenic phenotypes with Boolean interactions. bioRxiv. 2020 doi: 10.1101/2020.11.24.396846. Preprint at. [DOI] [PMC free article] [PubMed] [Google Scholar]
- 75.Dwivedi R., Tan Y.S., Park B., Wei M., Horgan K., Madigan D., Yu B. Stable discovery of interpretable subgroups via calibration in causal studies. Int. Stat. Rev. 2020;88:S135–S178. [Google Scholar]
- 76.Li X., Tang T.M., Wang X., Kocher J.-P.A., Yu B. A stability-driven protocol for drug response interpretable prediction (staDRIP) arXiv. 2020 doi: 10.48550/arXiv.2011.06593. Preprint at. [DOI] [Google Scholar]
- 77.Candel A., Parmar V., LeDell E., Arora A. ai Inc; 2016. Deep Learning with H2O. H2O; pp. 1–21. [Google Scholar]
- 78.Basu S., Kumbier K., Brown J.B., Yu B. Iterative random forests to discover predictive and stable high-order interactions. Proc. Natl. Acad. Sci. USA. 2018;115:1943–1948. doi: 10.1073/pnas.1711236115. [DOI] [PMC free article] [PubMed] [Google Scholar]
- 79.Prentice R.L., Pyke R. Logistic disease incidence models and case-control studies. Biometrika. 1979;66:403–411. [Google Scholar]
Associated Data
This section collects any data citations, data availability statements, or supplementary materials included in this article.
Supplementary Materials
Data Availability Statement
-
•
Relevant data supporting the findings of this study are available within the Article and Supplemental Materials.
-
•
No new code was generated for this study.
-
•
Any additional information required to reanalyze the data reported in this paper is available from the lead contact upon request.