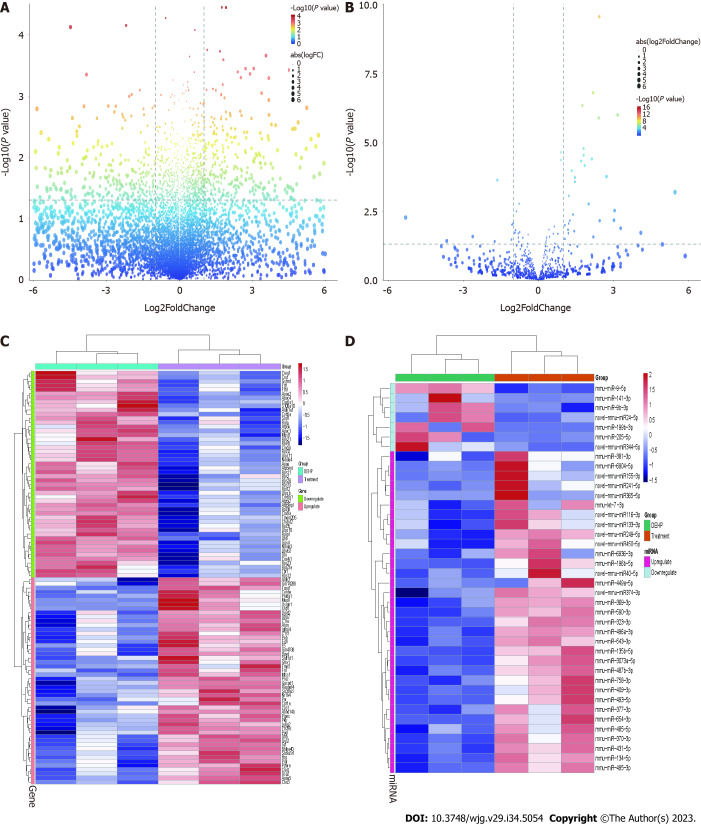
Figure 6.
Differential expression of mRNAs and microRNAs between the treatment and model groups. A: The volcano plot of differentially expressed mRNAs between the treatment and model groups. The upper left quadrant and the upper right quadrant in the figure represent downregulated and upregulated mRNAs, respectively; B: The volcano plot of differentially expressed microRNAs (miRNAs) between the treatment and model groups. The upper left quadrant and the upper right quadrant in the figure represent downregulated and upregulated miRNAs, respectively; C: Heatmap shows the 50 mRNAs that exhibited the highest upregulation and downregulation in the treatment group relative to the model group; D: Heatmap shows the miRNAs that exhibited the highest upregulation and downregulation in the treatment group relative to the model group.

