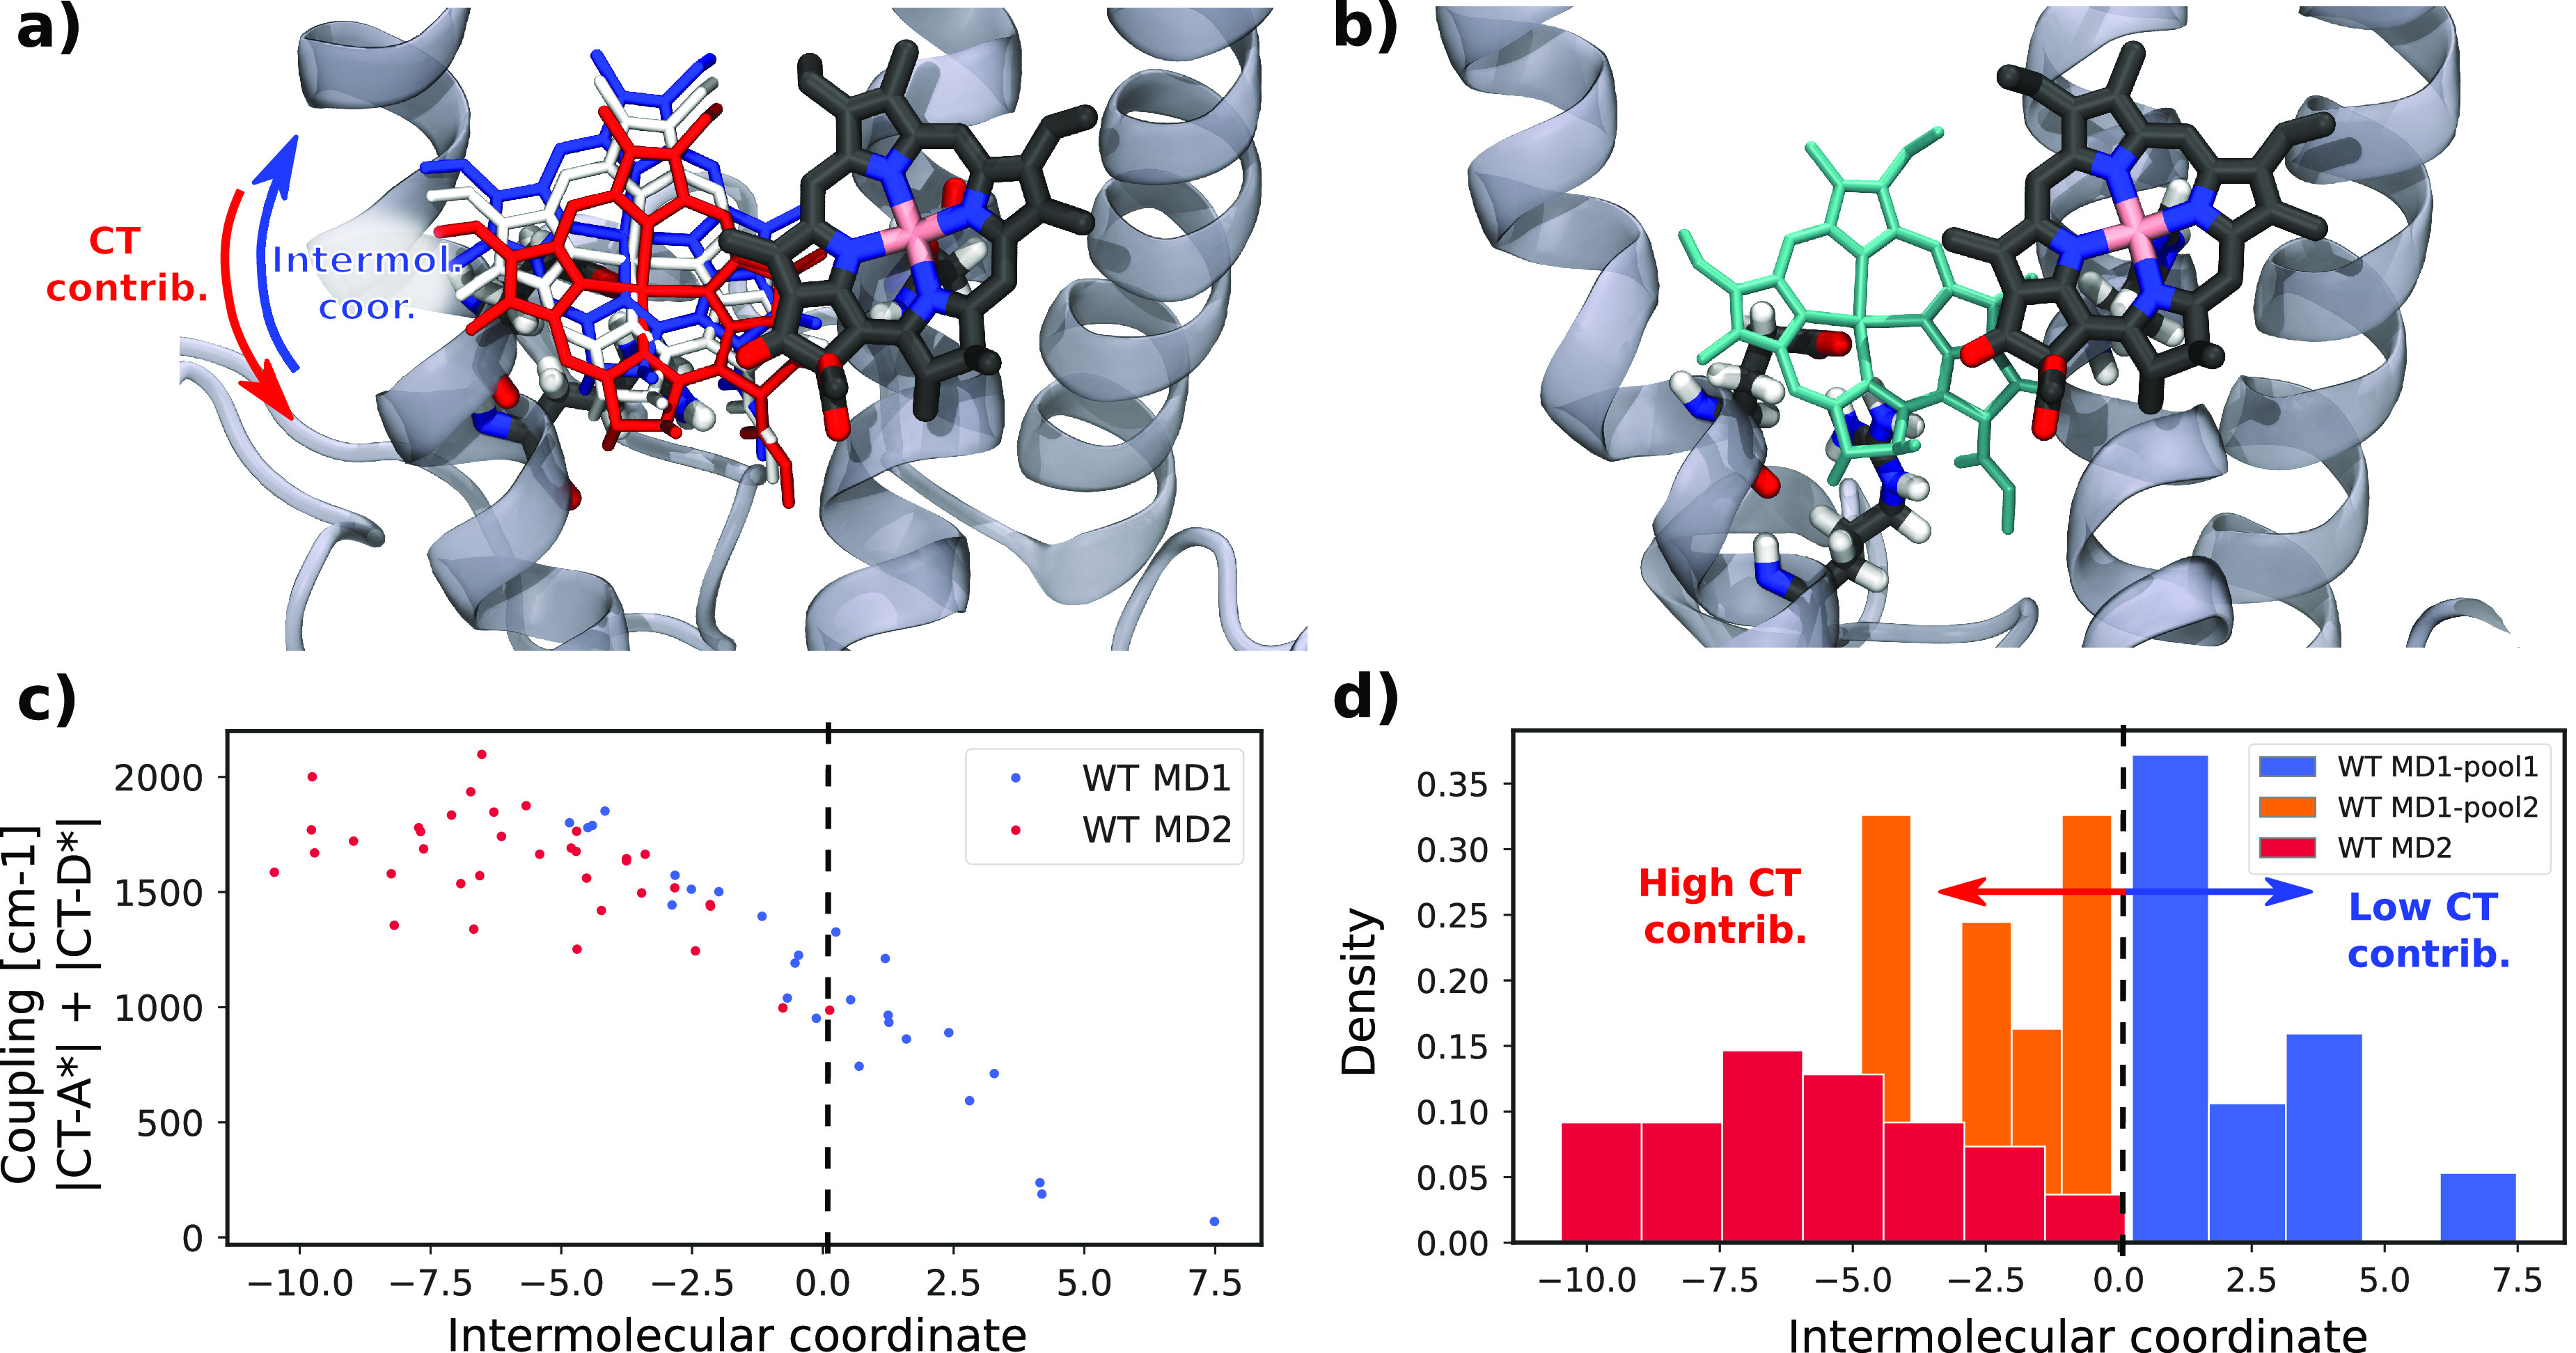
Figure 2.

Geometrical analysis of the CT pair. (a) Structural representation of the intermolecular coordinate obtained by principal component analysis of the interatomic distances. Red (blue) structures represent lower (higher) values of the coordinate. (b) CT pair for the N98H mutant shown with the same orientation of the Chl a603 as for the WT. (c) Dependence of the coupling between LE and CT states on the intermolecular coordinate. (d) Projection of all the WT structures into the intermolecular coordinate and separation of the structures from the first replica (MD1) according to the similarity with the second replica (MD2).
