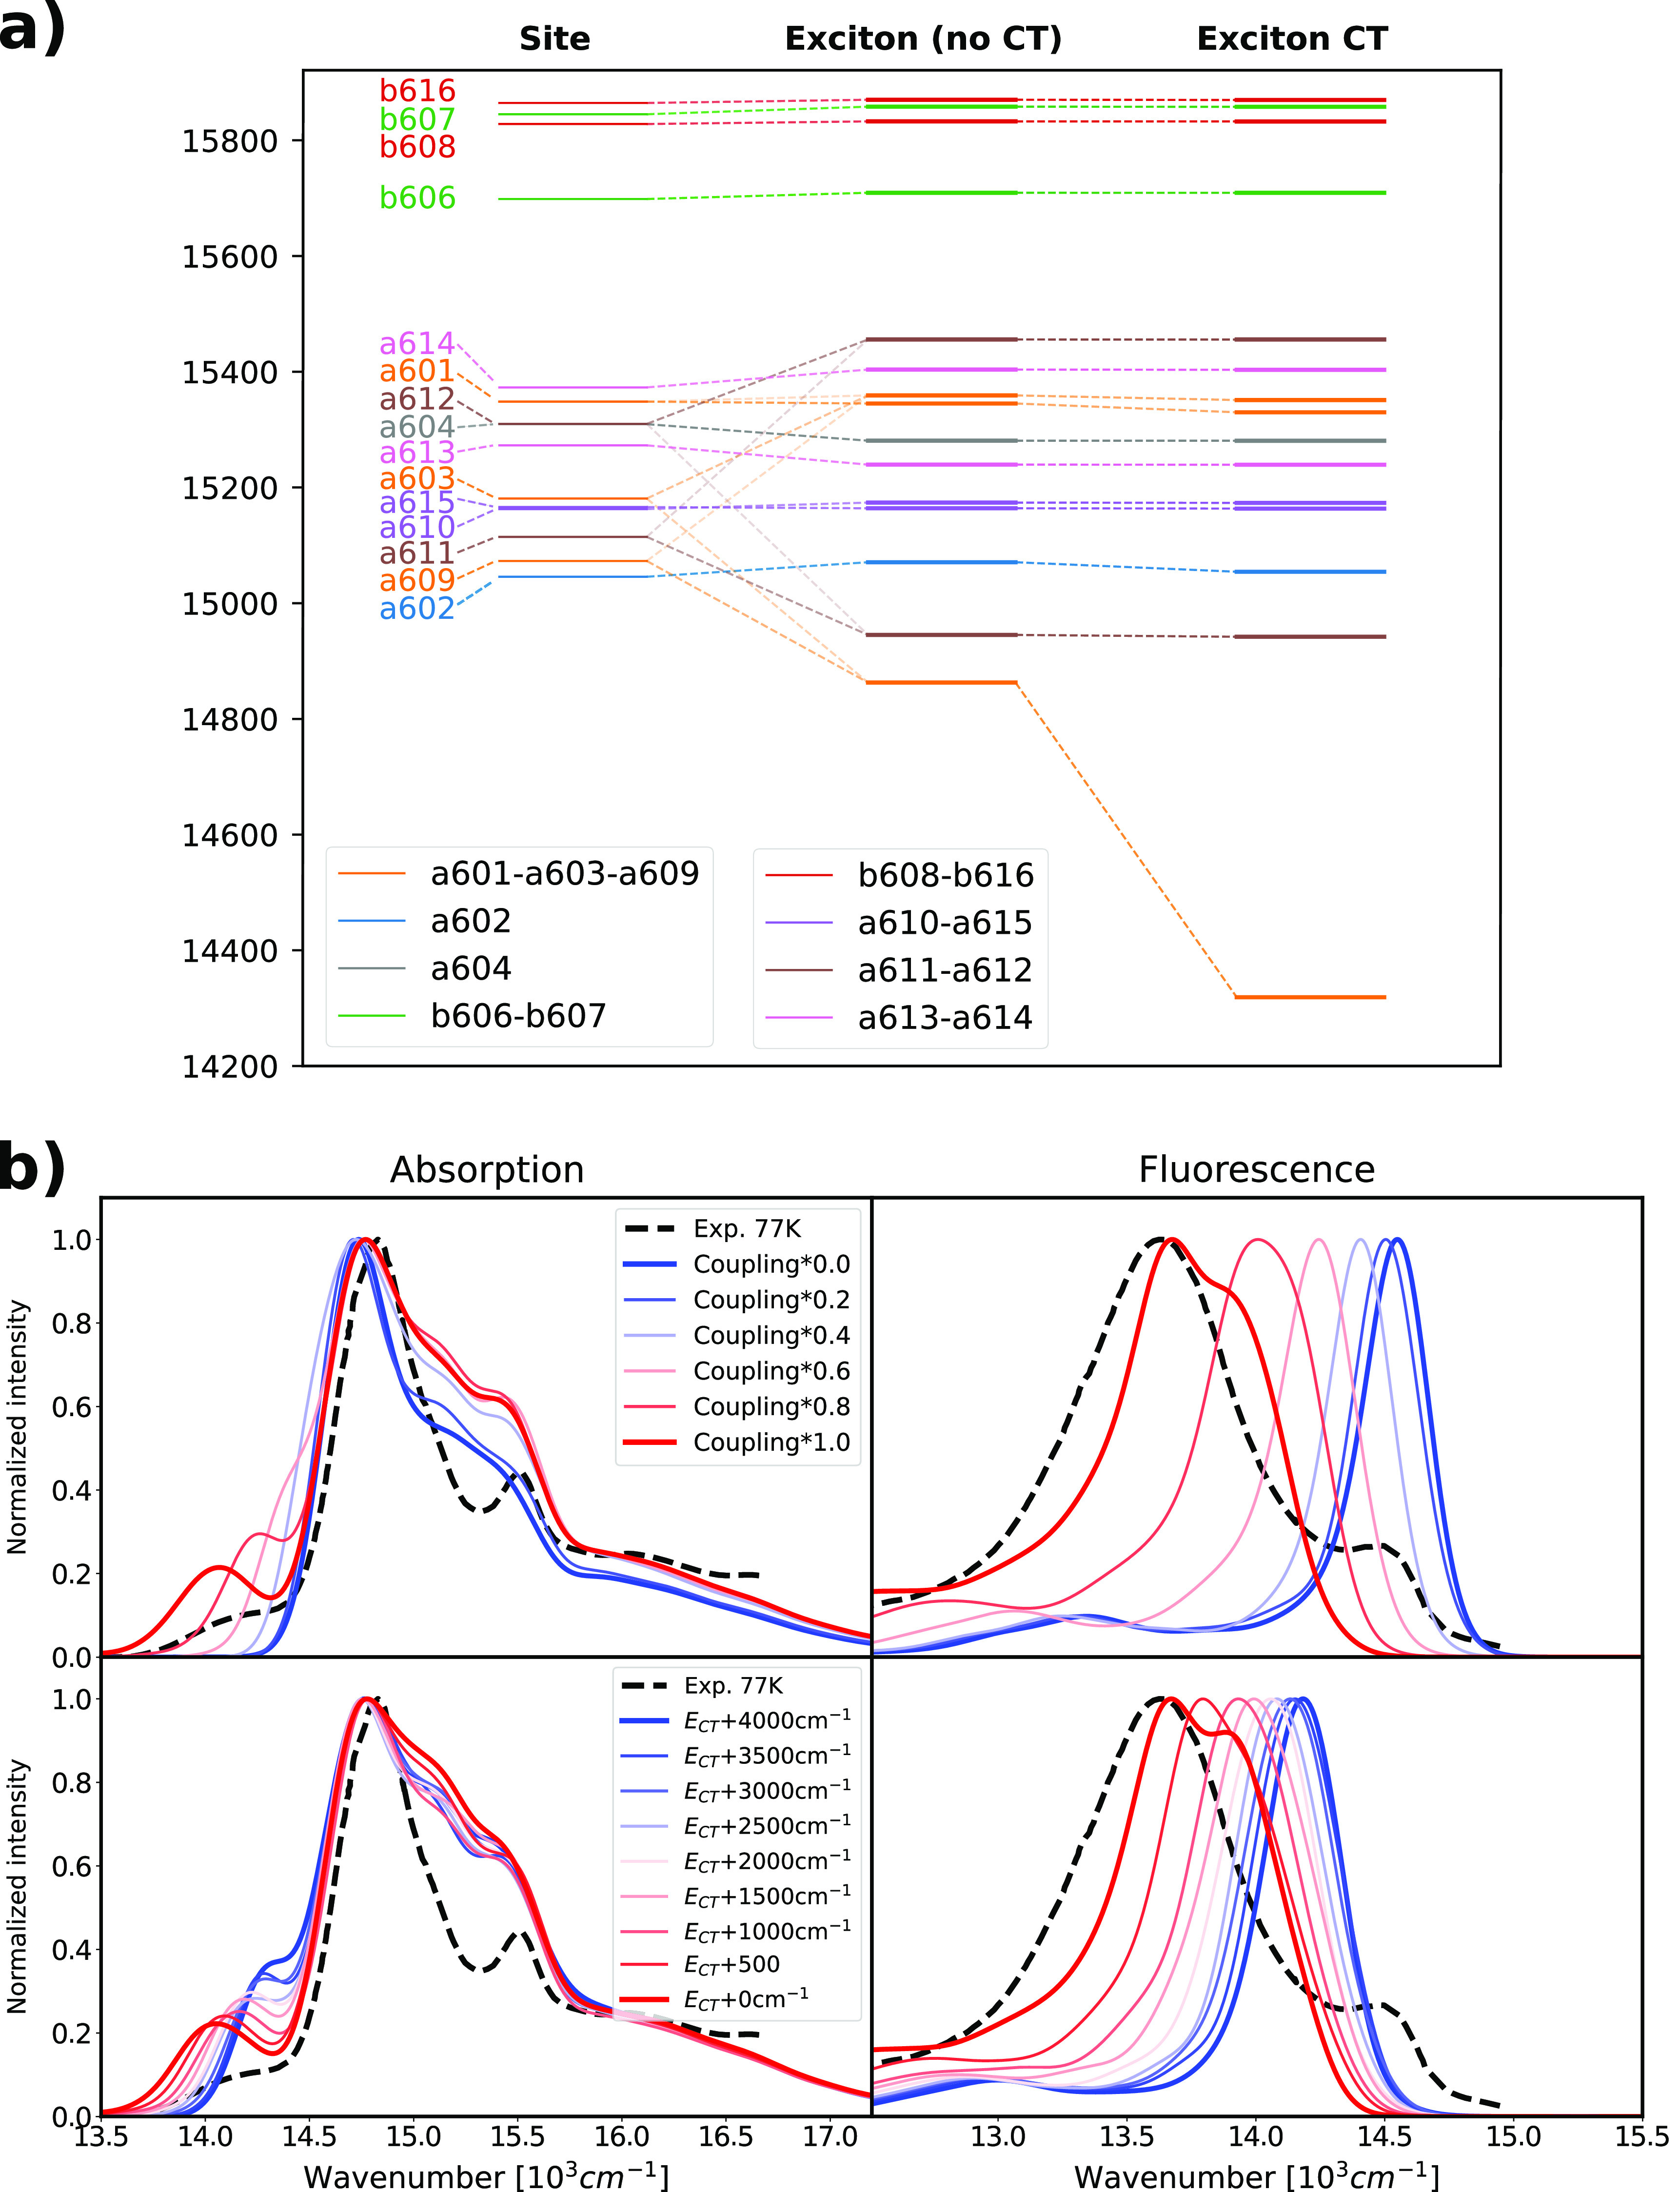
Figure 4.

Exciton state composition and effect of the CT states and resulting optical spectra for the structures in WT-MD2. (a) Representation of the contribution of the exciton states and the effect of the CT states. The analysis was performed on the average WT-MD2 Hamiltonian. The leftmost column represents the site energies of the Chl Qy states (CT states are not shown); the middle column shows the exciton energies obtained excluding the CT states from the Hamiltonian, while the right column shows the exciton energies obtained from the full exciton-CT Hamiltonian. (b) Effect of the coupling between Qy and the CT state and CT state energy on the optical spectra. The coupling was gradually reduced from the MD2 values to zero by applying a uniform scaling, as shown in the legend. The CT state energy was gradually increased from the MD2 values to +4000 cm–1, fixing the couplings. All computed spectra were shifted by −1261 cm–1 to compare with experiments. Experimental absorption and fluorescence spectra are taken from ref (27) and shown as dashed lines.
