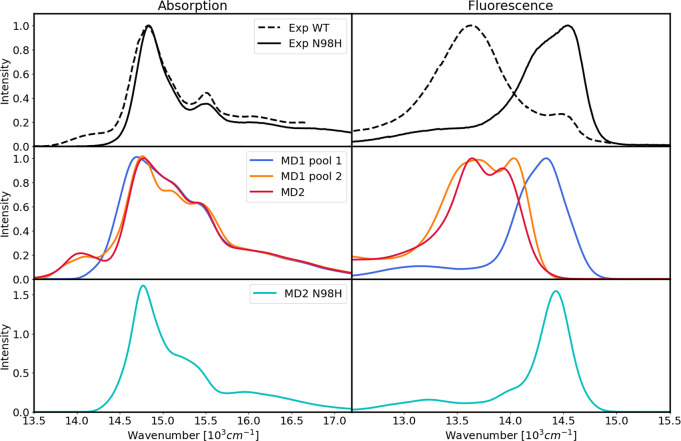
Figure 5.
Optical spectra of Lhca4 at 77 K. Top row: experimental absorption (left) and fluorescence (right) spectra of Lhca4. The results for MD4 are shown in Figure S11 in the SI. Middle row: optical spectra of the different replicas and pools of the WT. Bottom row: optical spectra of the N98H mutant. All computed spectra were shifted by −1261 cm–1 to compare with experiments. The experimental spectra were obtained from ref (27).

