
Figure 4.
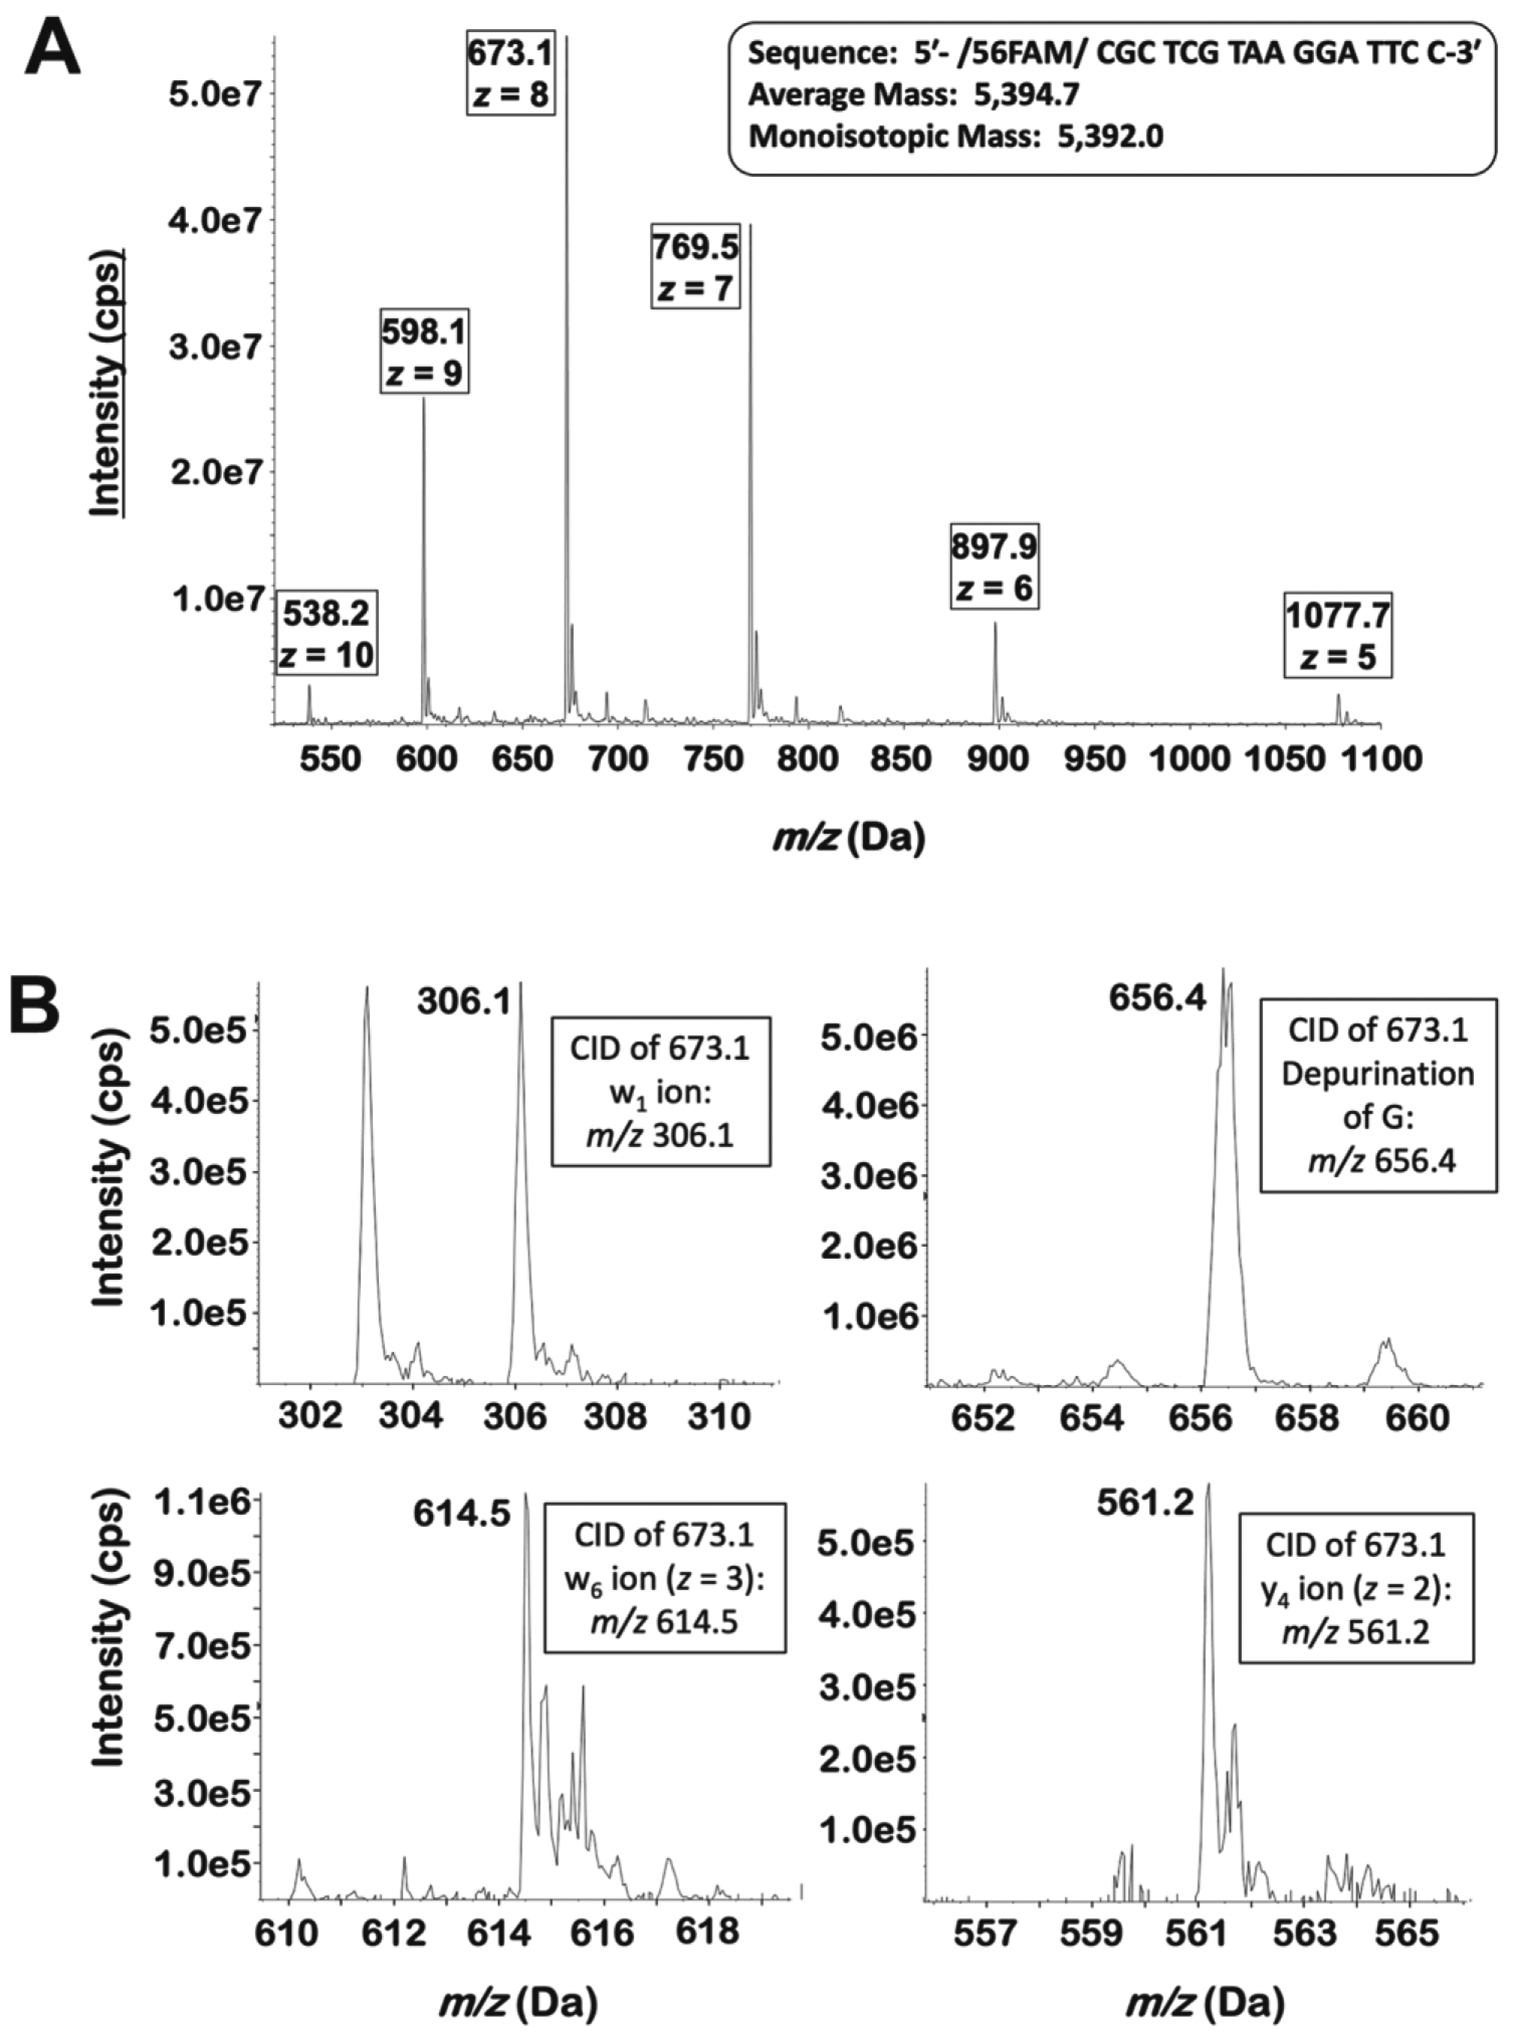
Mass spectra of the 16C oligonucleotide. (A) The Q1 spectrum of oligonucleotide 16C when infused directly. Multiple charge states are observed, with the z = 8 peak predominating. (B) Upon collision-induced dissociation of the z = 8 peak (m/z 673.1), many of the predicted w and y ions are observed. Additionally, a peak corresponding to the depurination of G is seen.