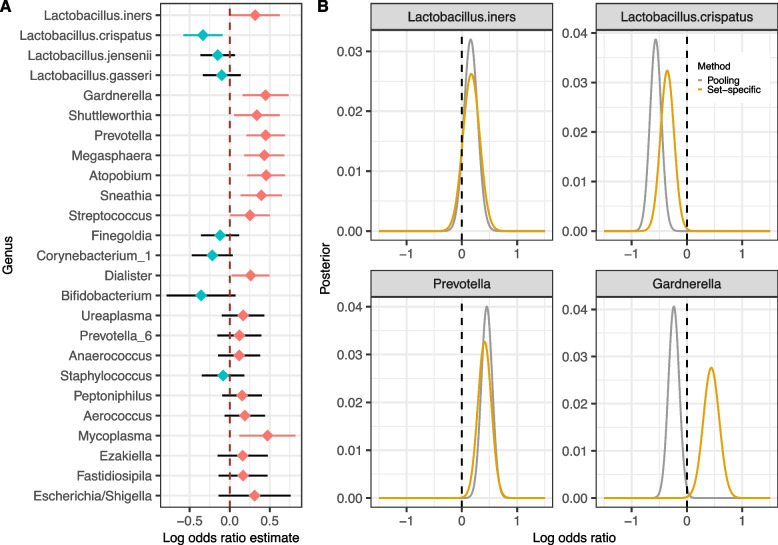
Fig. 5.
Cross-dataset differential abundance analysis. A Point estimates and 95% confidence intervals of the log odds ratio of a genus being present in preterm births relative to term births using a generalized linear mixed model. Presence was defined as a relative abundance greater than 0.001. The model included all 12 datasets and no population characteristic covariates. Point estimates less than 0 are shown as blue points and greater than 0 as red points. Confidence intervals less than 0 are shown as blue bars and greater than 0 as red bars. B Posterior distribution of log odds ratio using pooling and set-specific methods for four selected genera/species

