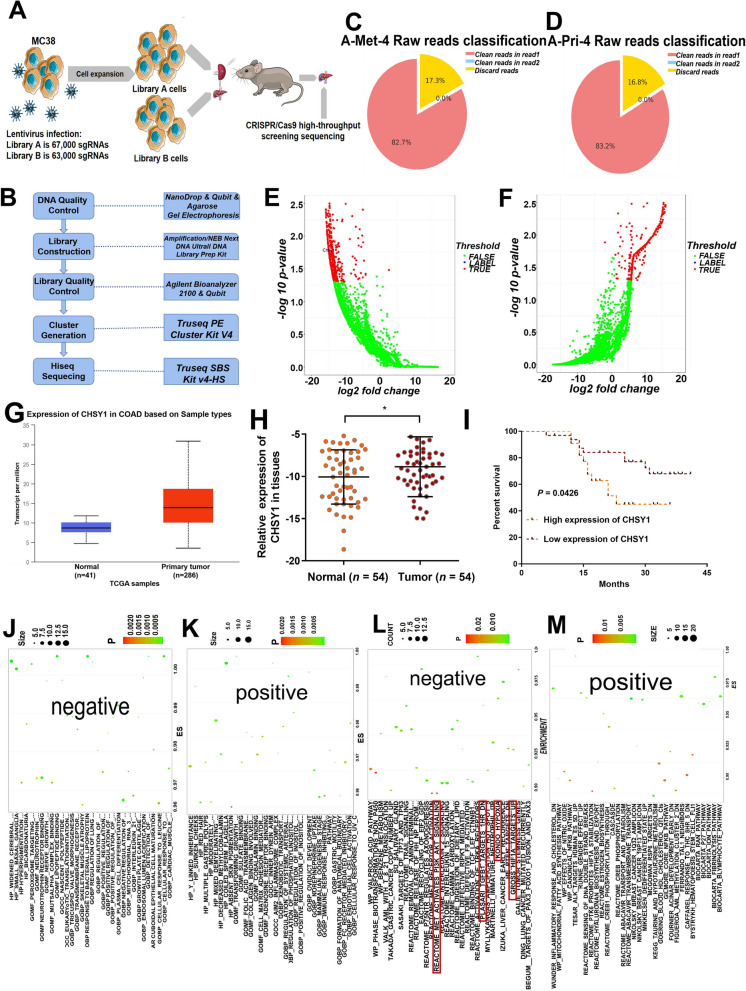
Fig. 1.
CRISPR/Cas9 screen results of CRC liver metastasis model in vivo. A Flow chart of CRISPR/Cas9 high-throughput screening sequencing. B The complete process of CRISPR/Cas9 screen technology. C-D Sequence composition of metastatic (C) and primary (D) foci. E–F Volcano plot of genes with significantly different negative(E) and positive (F) screening results. G TCGA results showed that CHSY1 was significantly overexpressed in CRC tissues compared with that in the corresponding paracancerous tissues. H The expression of CHSY1 was validated in qRT-PCR results of 54 CRC patients. I The CRC patients with high CHSY1 expression had reduced overall survival. J-K GO analysis pathway in negative (J) and positive (K) groups.(L-M) KEGG analysis pathway in negative (L) and positive (M) groups. *, P < 0.05

