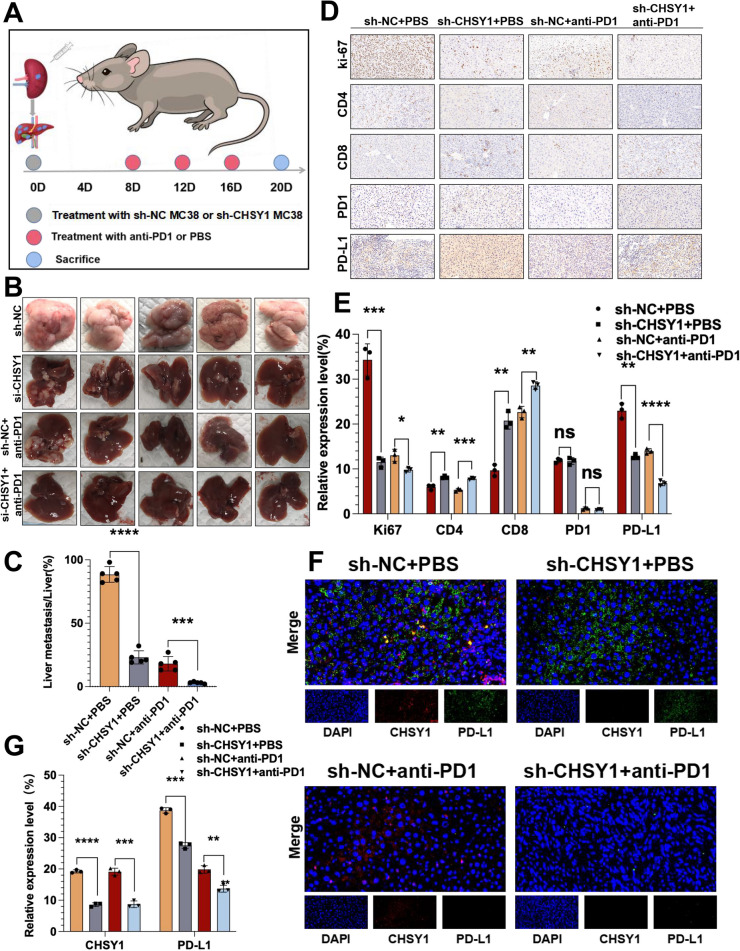
Fig. 5.
The anti-tumor effect of knockdown CHSY1 combined with anti-PD1 in vivo. A Schematic diagram of the establishment of a mouse model of CRC liver metastases. B Images of liver metastases in each group. C Analysis of liver metastases tumors in the respective groups. (multiple unpaired t test) (D, E) Immunohistochemistry results of CD8, CD4, Ki67, PD-L1 and PD1 expression in the respective groups. F, G The immunofluorescence was used to detect the expression of CHSY1 and PD-L1 in liver metastases in each group. *, P < 0.05; **, P < 0.01; ***, P < 0.001;****, P < 0.0001.ns indicates no statistical difference

