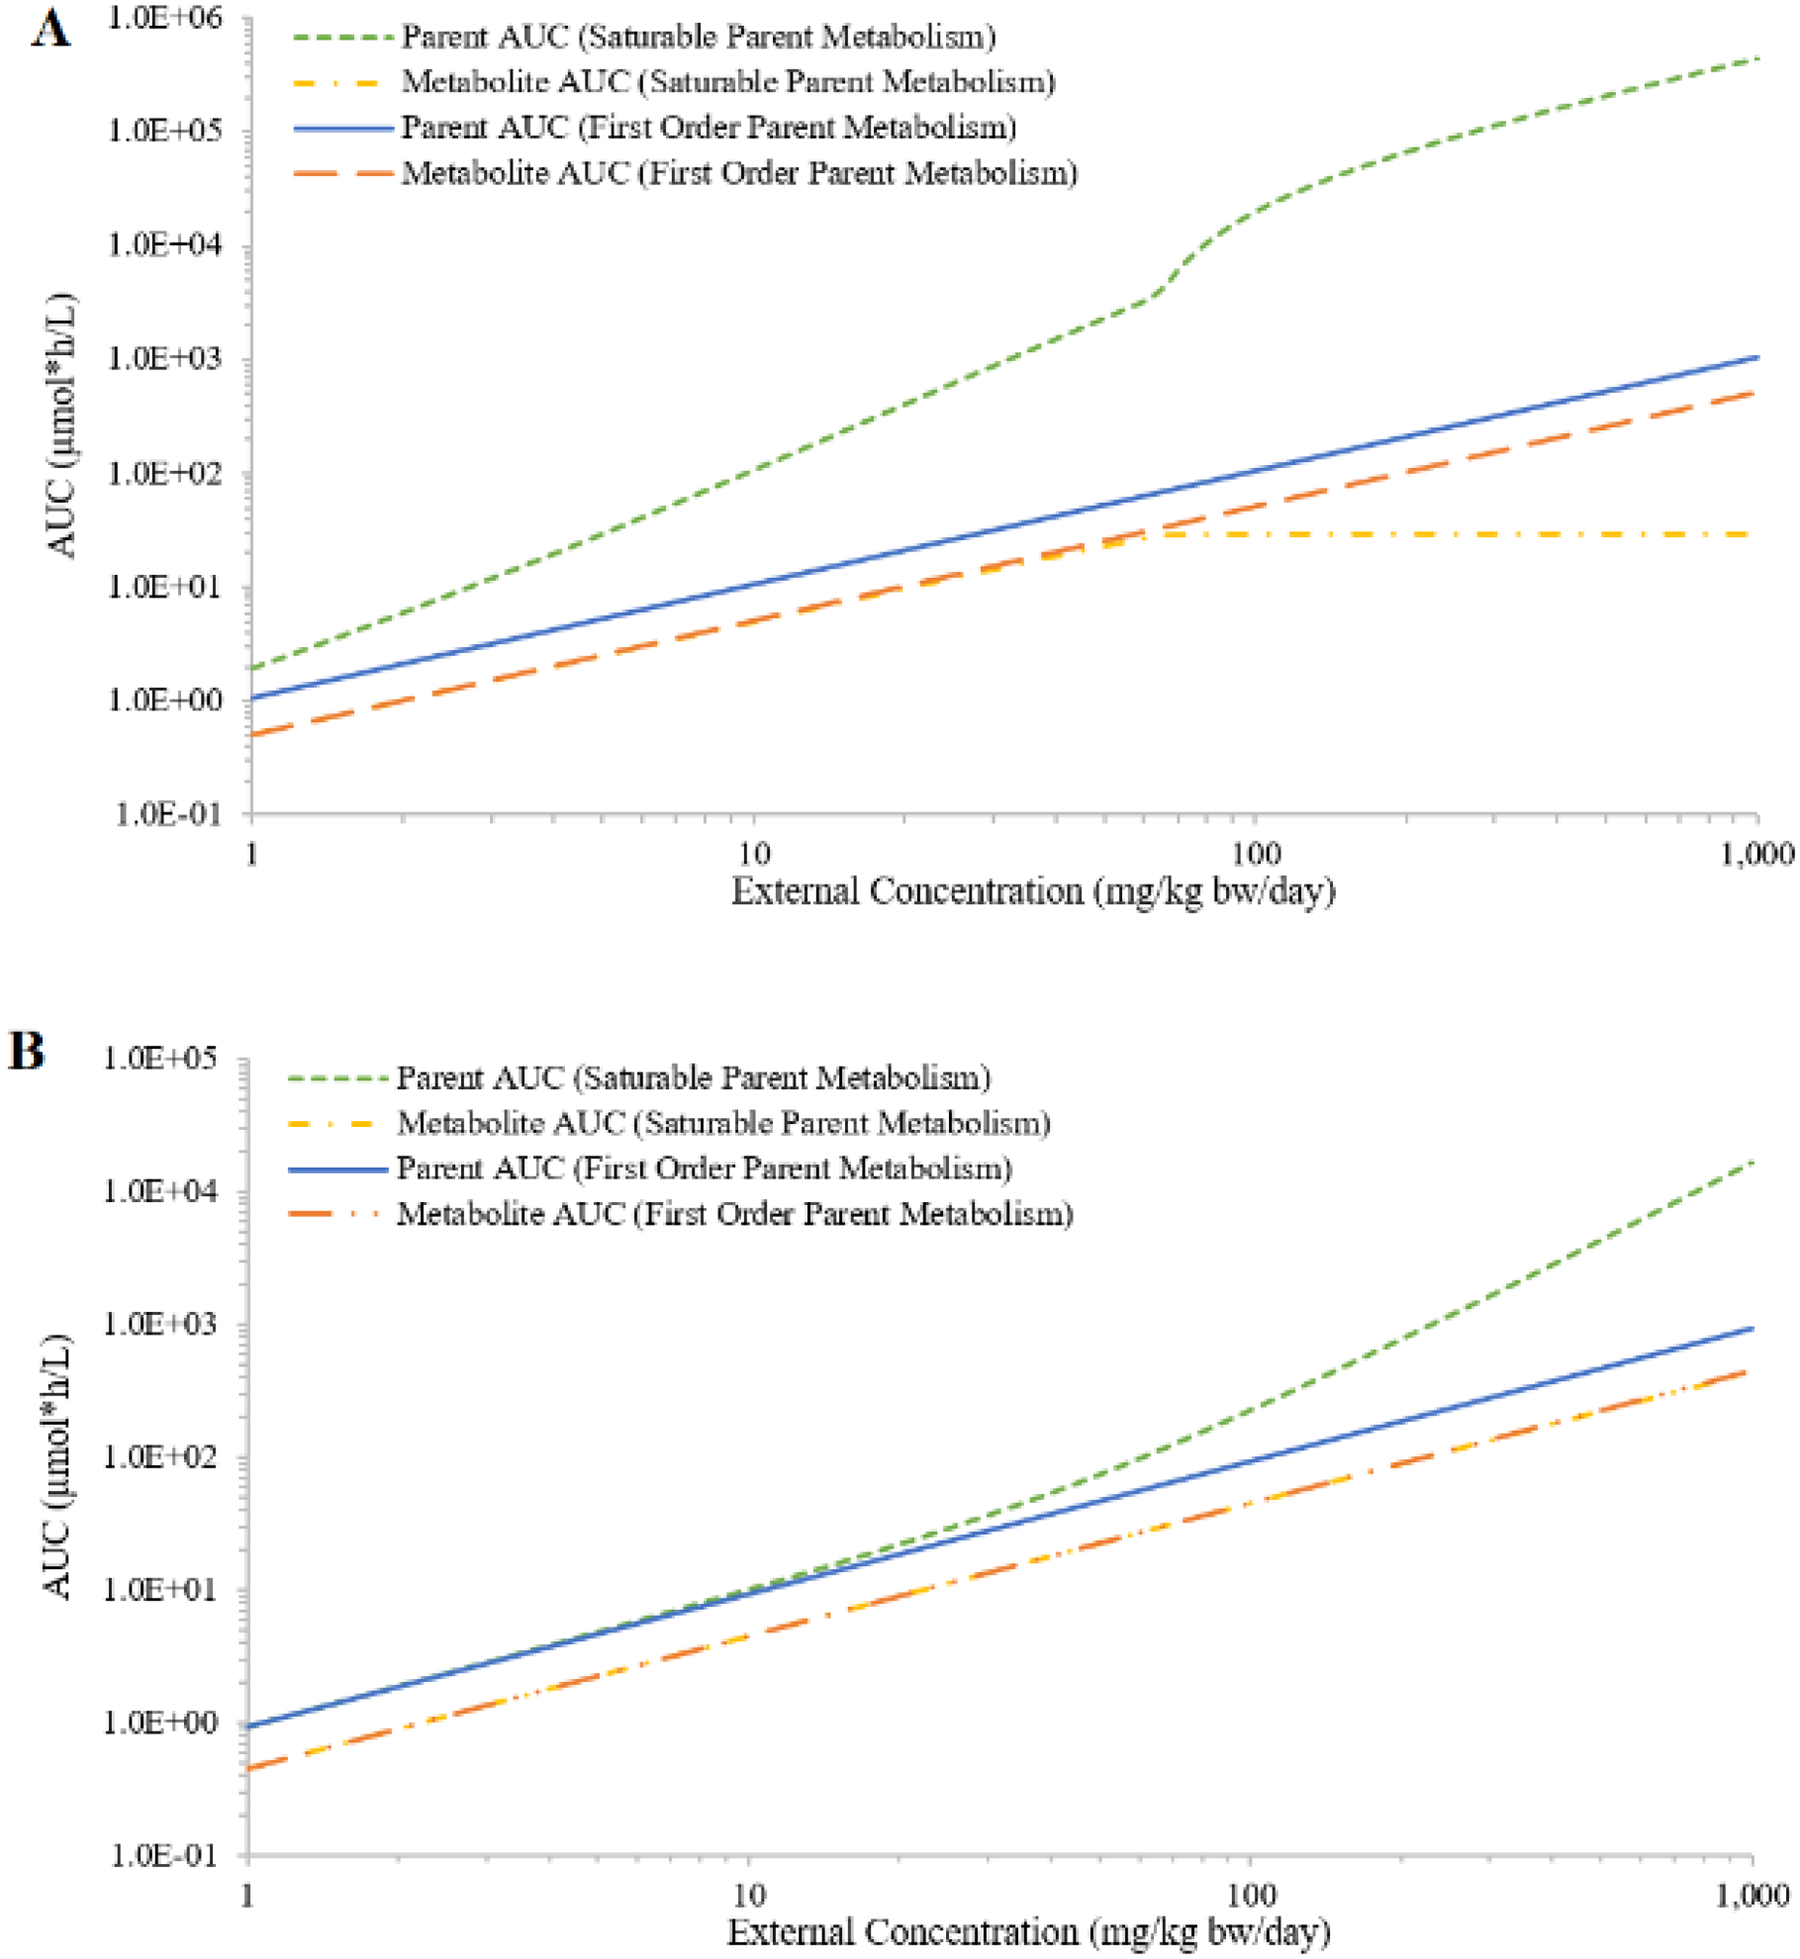
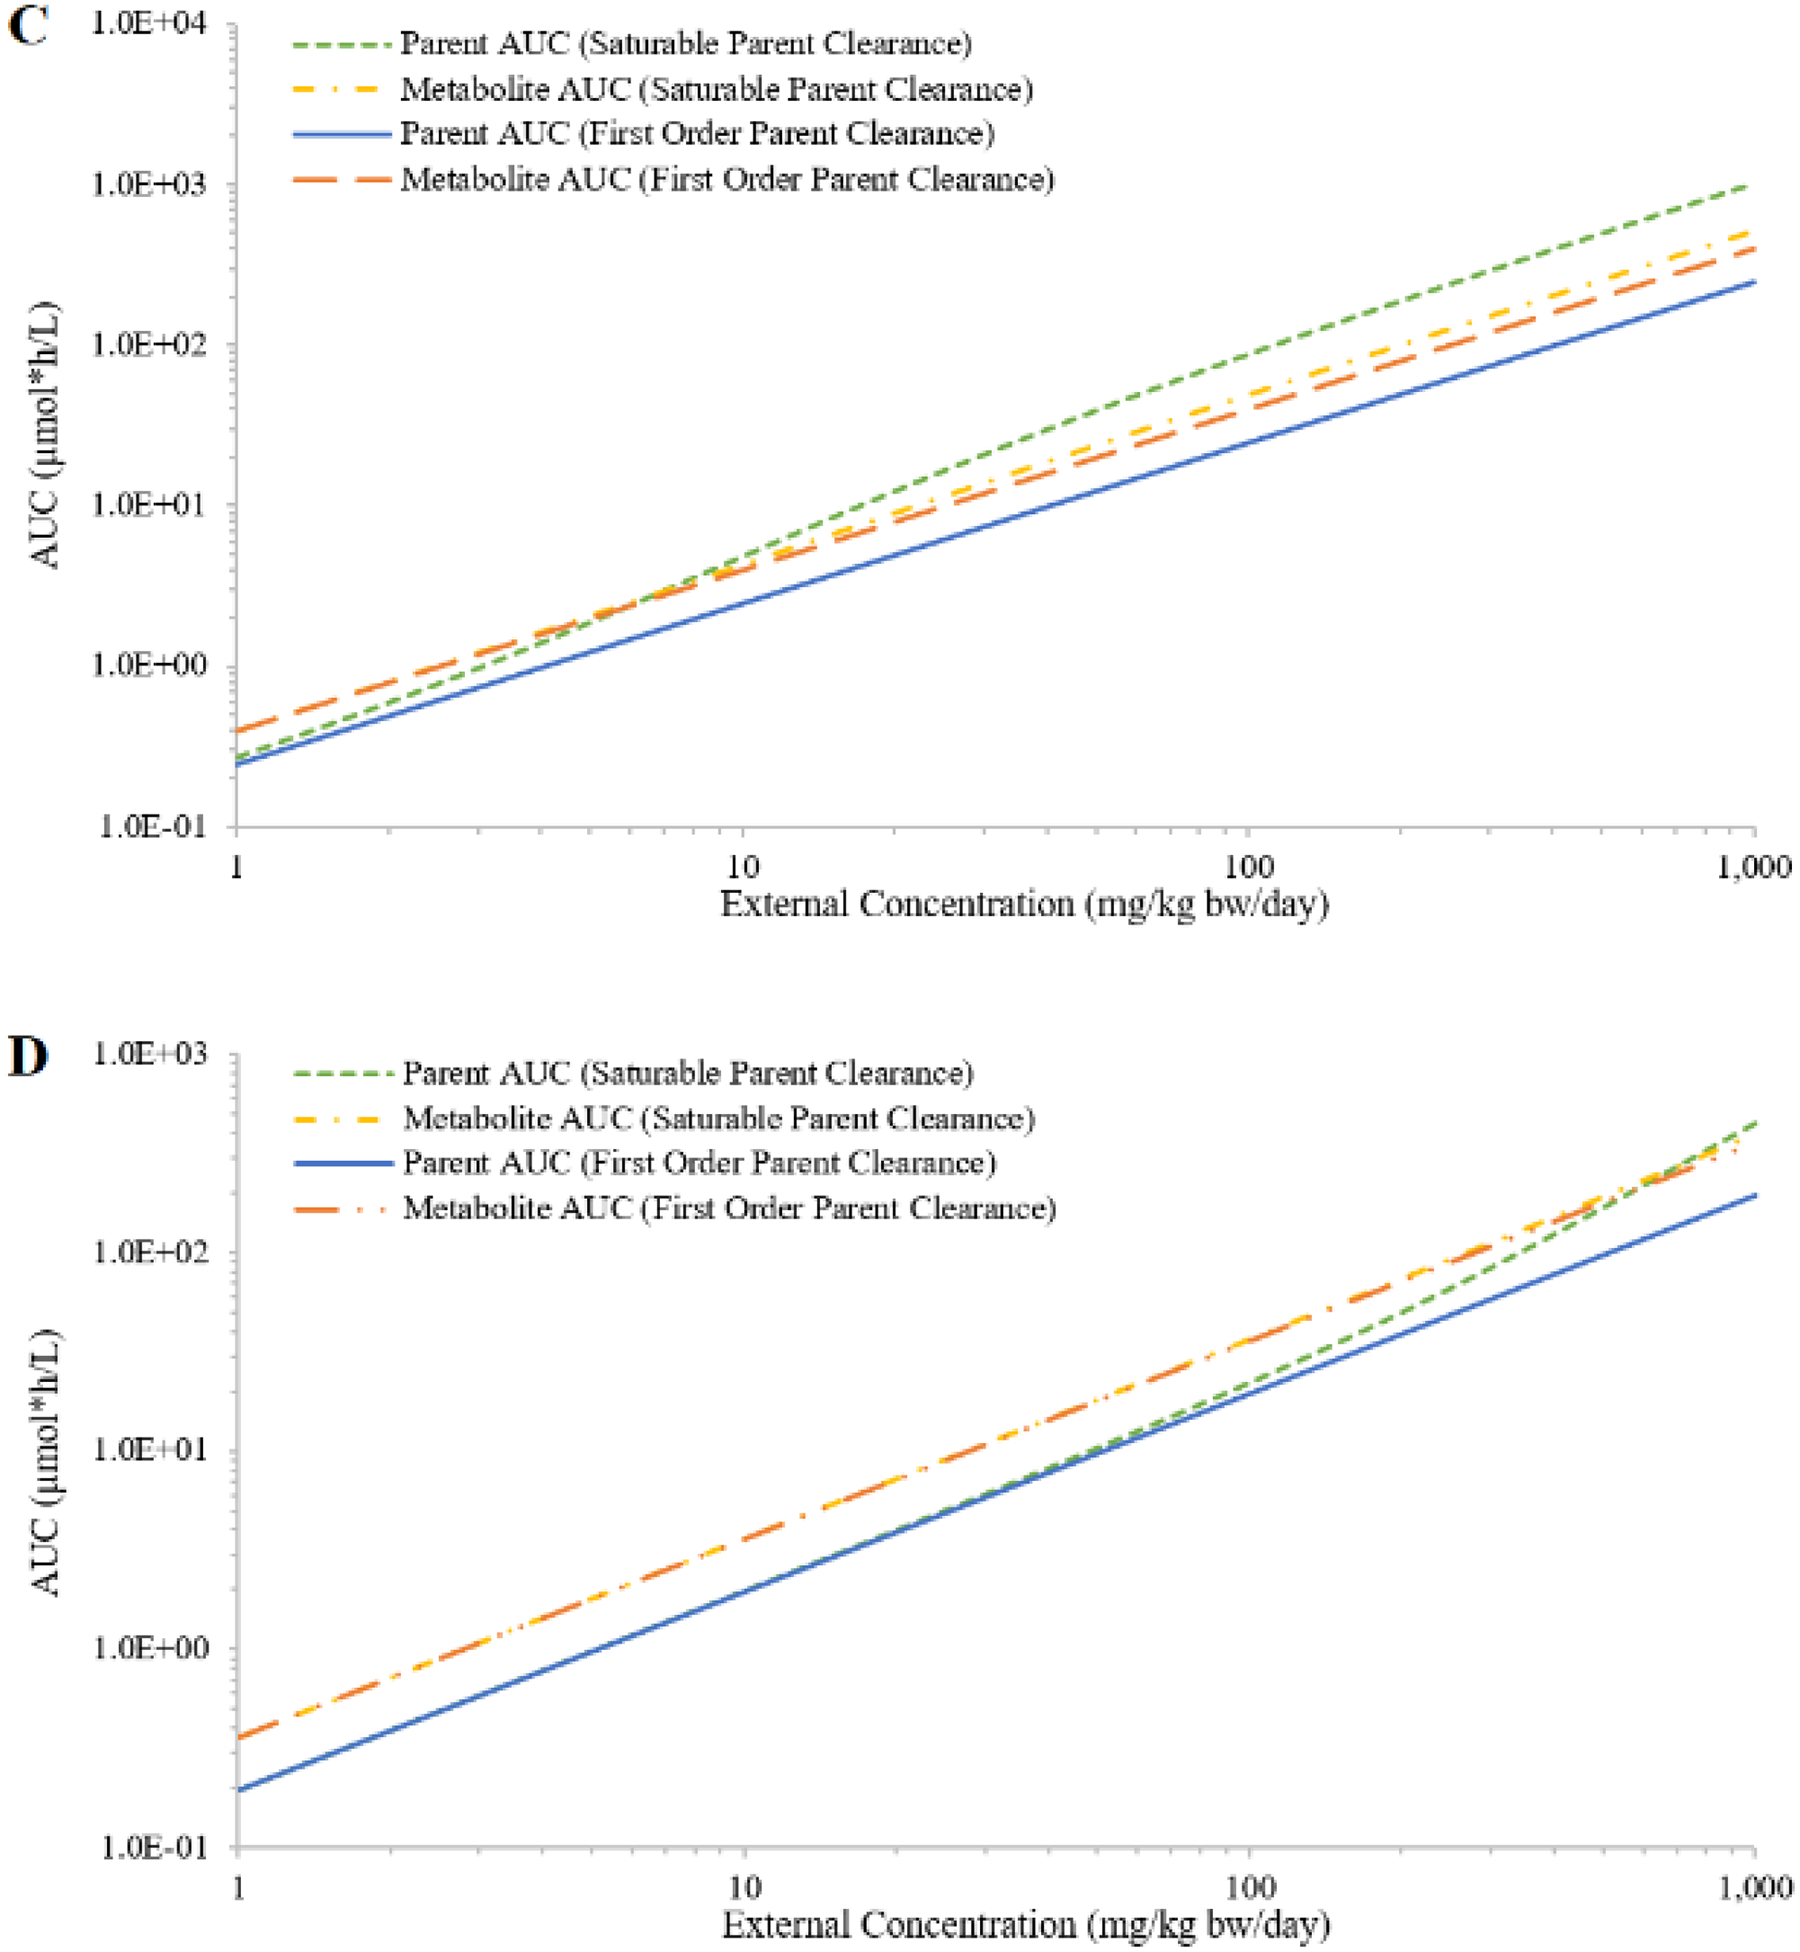
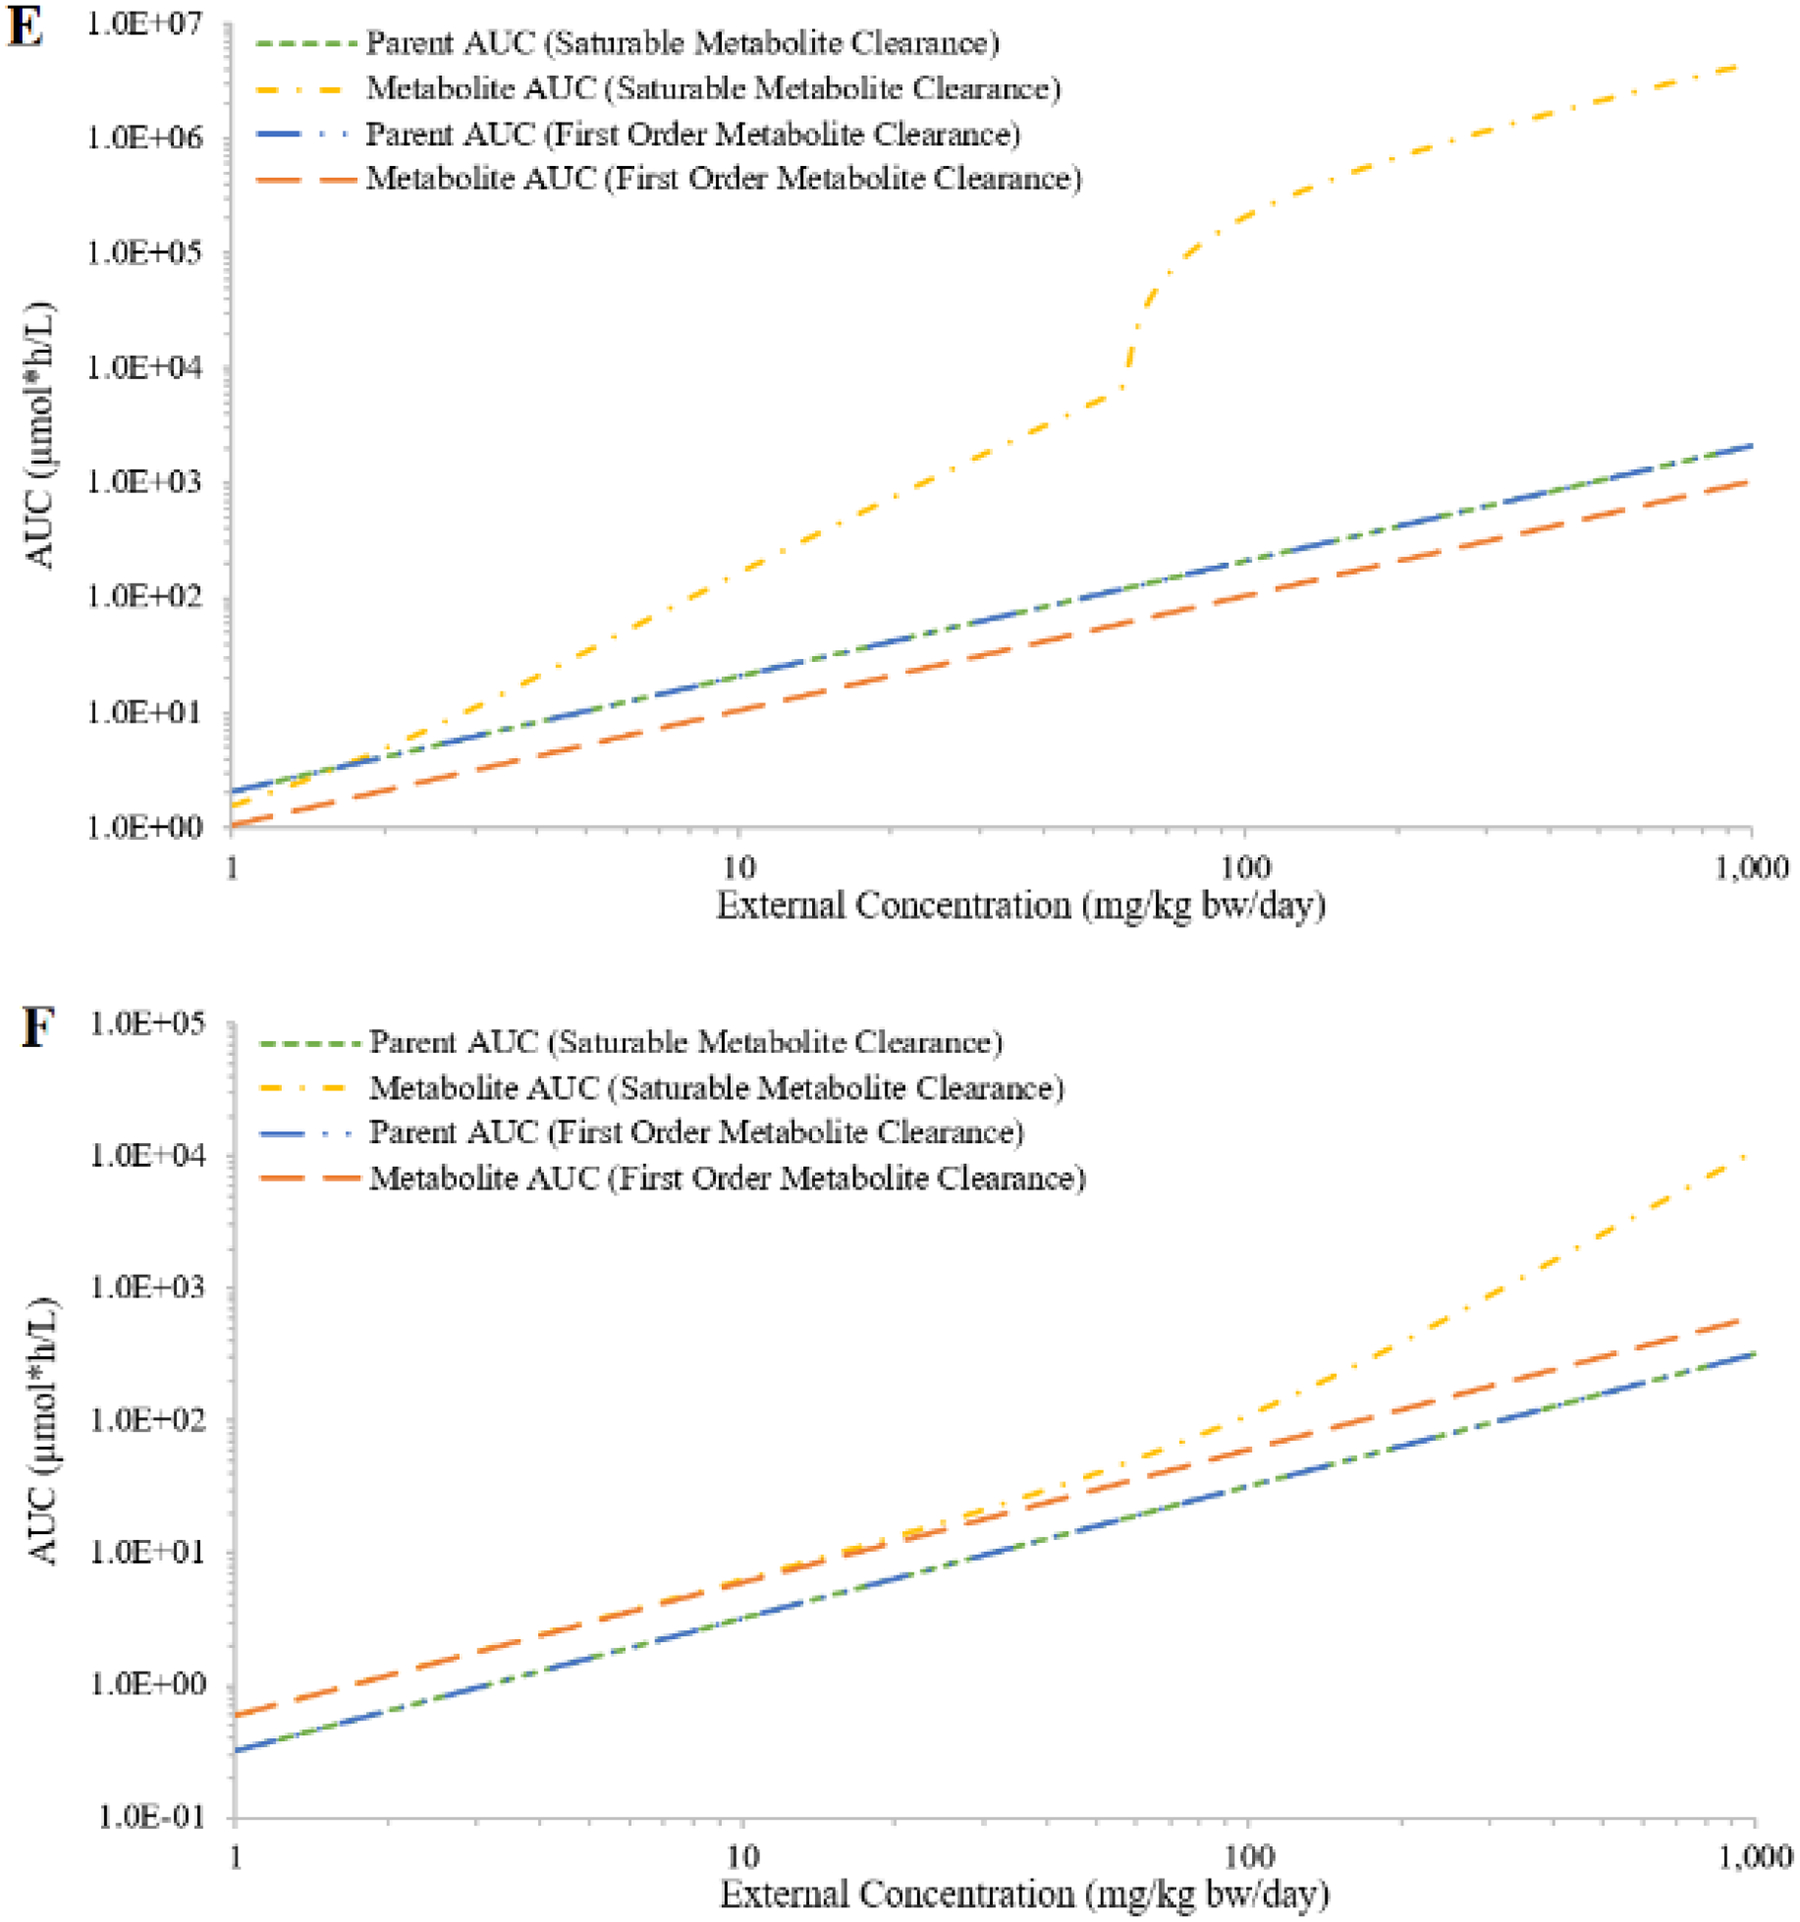
Figure 4:


Simulated external concentrations (mg/kg bw/day) versus area under the curve of plasma concentrations during the last 24 hours (AUC; in μmole*h/L) of the parent and the metabolite, assuming saturable or first-order metabolism for hypothetical chemicals A (panel A) and B (panel B); saturable or first-order urinary excretion for hypothetical chemicals A (panel C) and B (panel D); or saturable or first-order urinary excretion of the metabolites for hypothetical chemicals A (panel E) and B (panel F).
