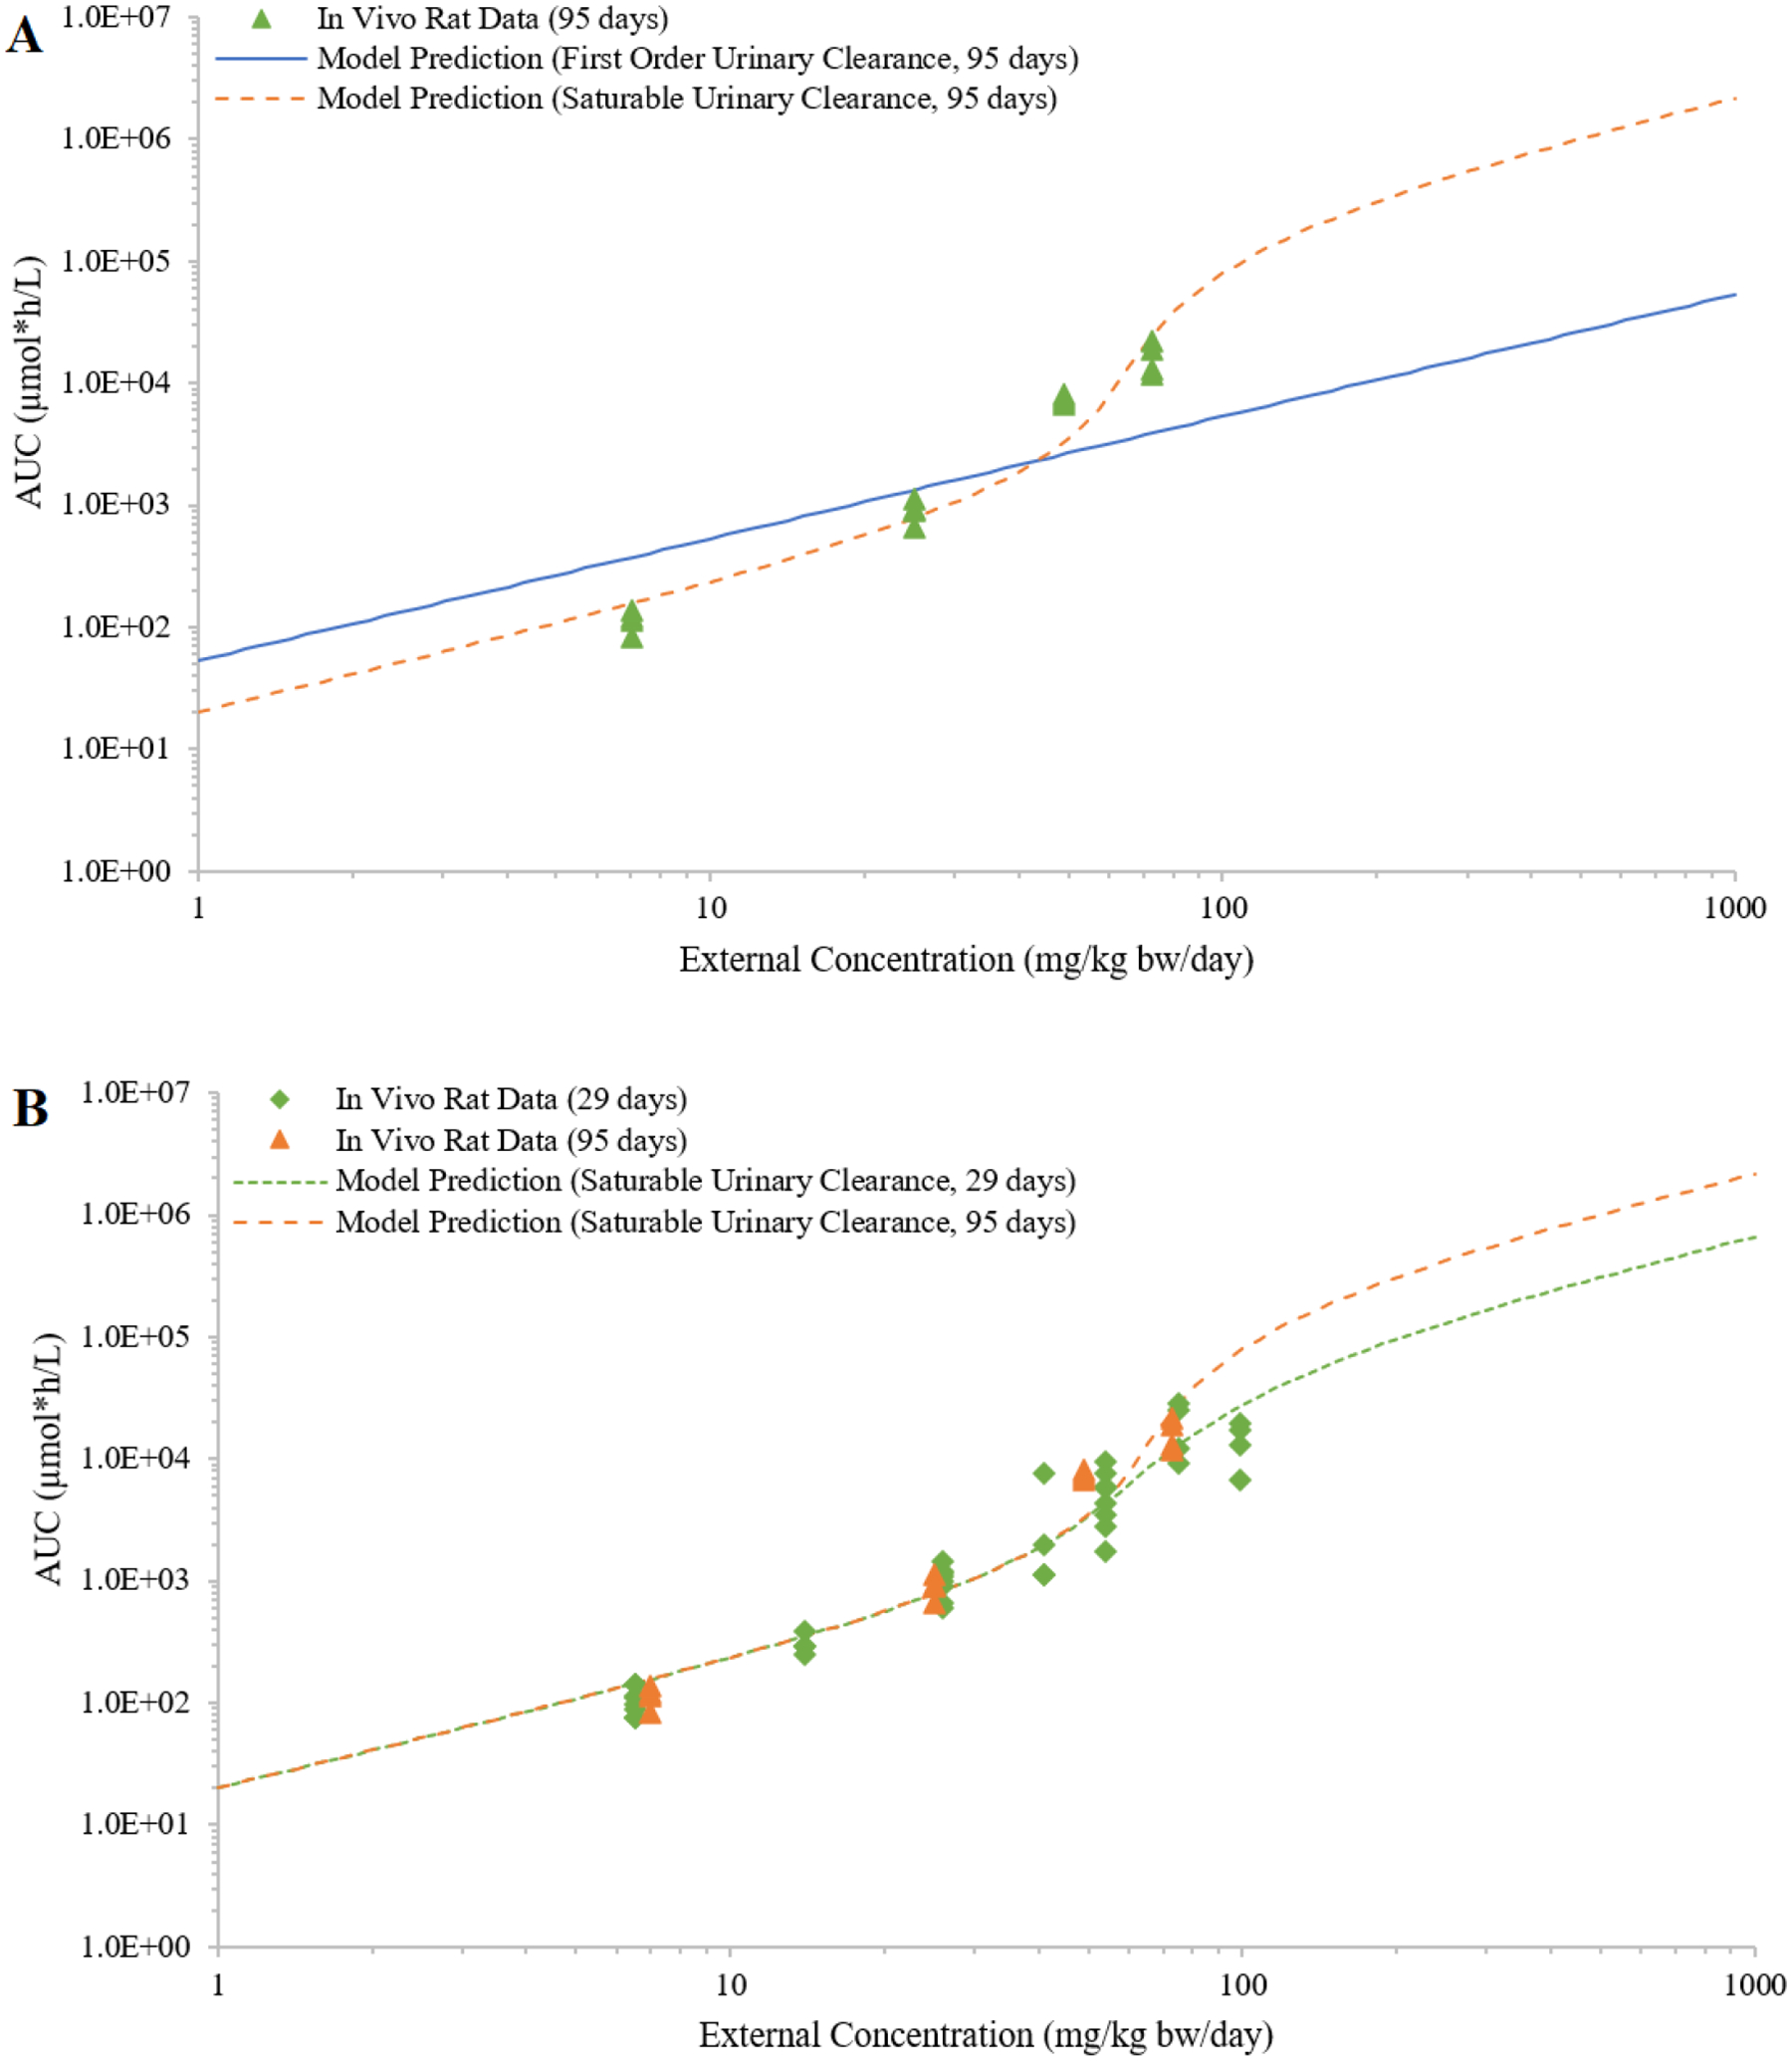
Figure 9:

Simulated external concentrations (mg/kg bw/day) versus area under the curve of plasma concentrations during the last 24 hours (AUC; in μmole*h/L) of 2,4-Dichlorophenoxyacetic acid (2,4-D) from dietary exposures of female rats is compared to in vivo data. Panel A shows plasma concentrations from a 95-day in vivo study, and simulated plasma concentration curves with saturable (VmaxU = 2.91; KmU = 58.5) or first-order urinary clearance (CLU= 0.0186) of 2,4-D. Panel B compares the in vivo data and saturable urinary clearance (VmaxU = 2.91; KmU = 58.5) curves for both 29-day and 95-day exposures.
