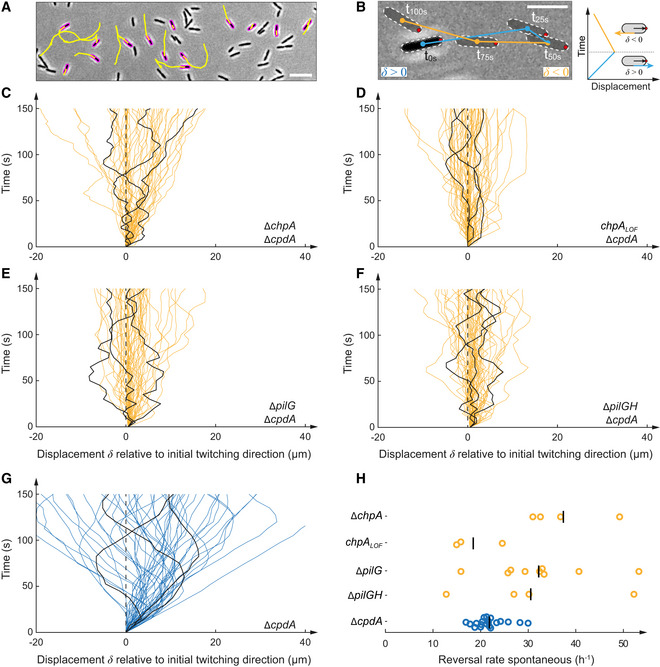
Figure 5. ChpA regulates forward and reverse twitching.

-
ASnapshot of 5‐min‐long twitching trajectories (yellow lines). Scale bar, 10 μm.
-
BComputation of displacement maps and reversal rates. A change in the orientation of the track relative to the initially leading pole (red dot) corresponds to a reversal. Scale bar, 5 μm.
-
C–GDisplacement maps derived from 50 randomly selected cell trajectories from three random biological replicates. Each curve corresponds to an individual trajectory. A curve oriented to the top right corresponds to forward twitching, and a curve oriented to the top left corresponds to reverse twitching. In each graph, we highlighted three representative tracks for clarity.
-
HCorresponding spontaneous reversal rates. To bypass low cAMP levels, cpdA was deleted in all displayed strains. We use ΔcpdA as reference. Deletion and loss‐of‐function mutation of chpA show a hyper‐reversing phenotype, similar to deletion of pilG. ΔpilG ΔpilH double mutants also hyper‐reverse, phenocopying ΔpilG and ΔchpA/chpA LOF mutants. For corresponding example movies, see Movie EV2.
