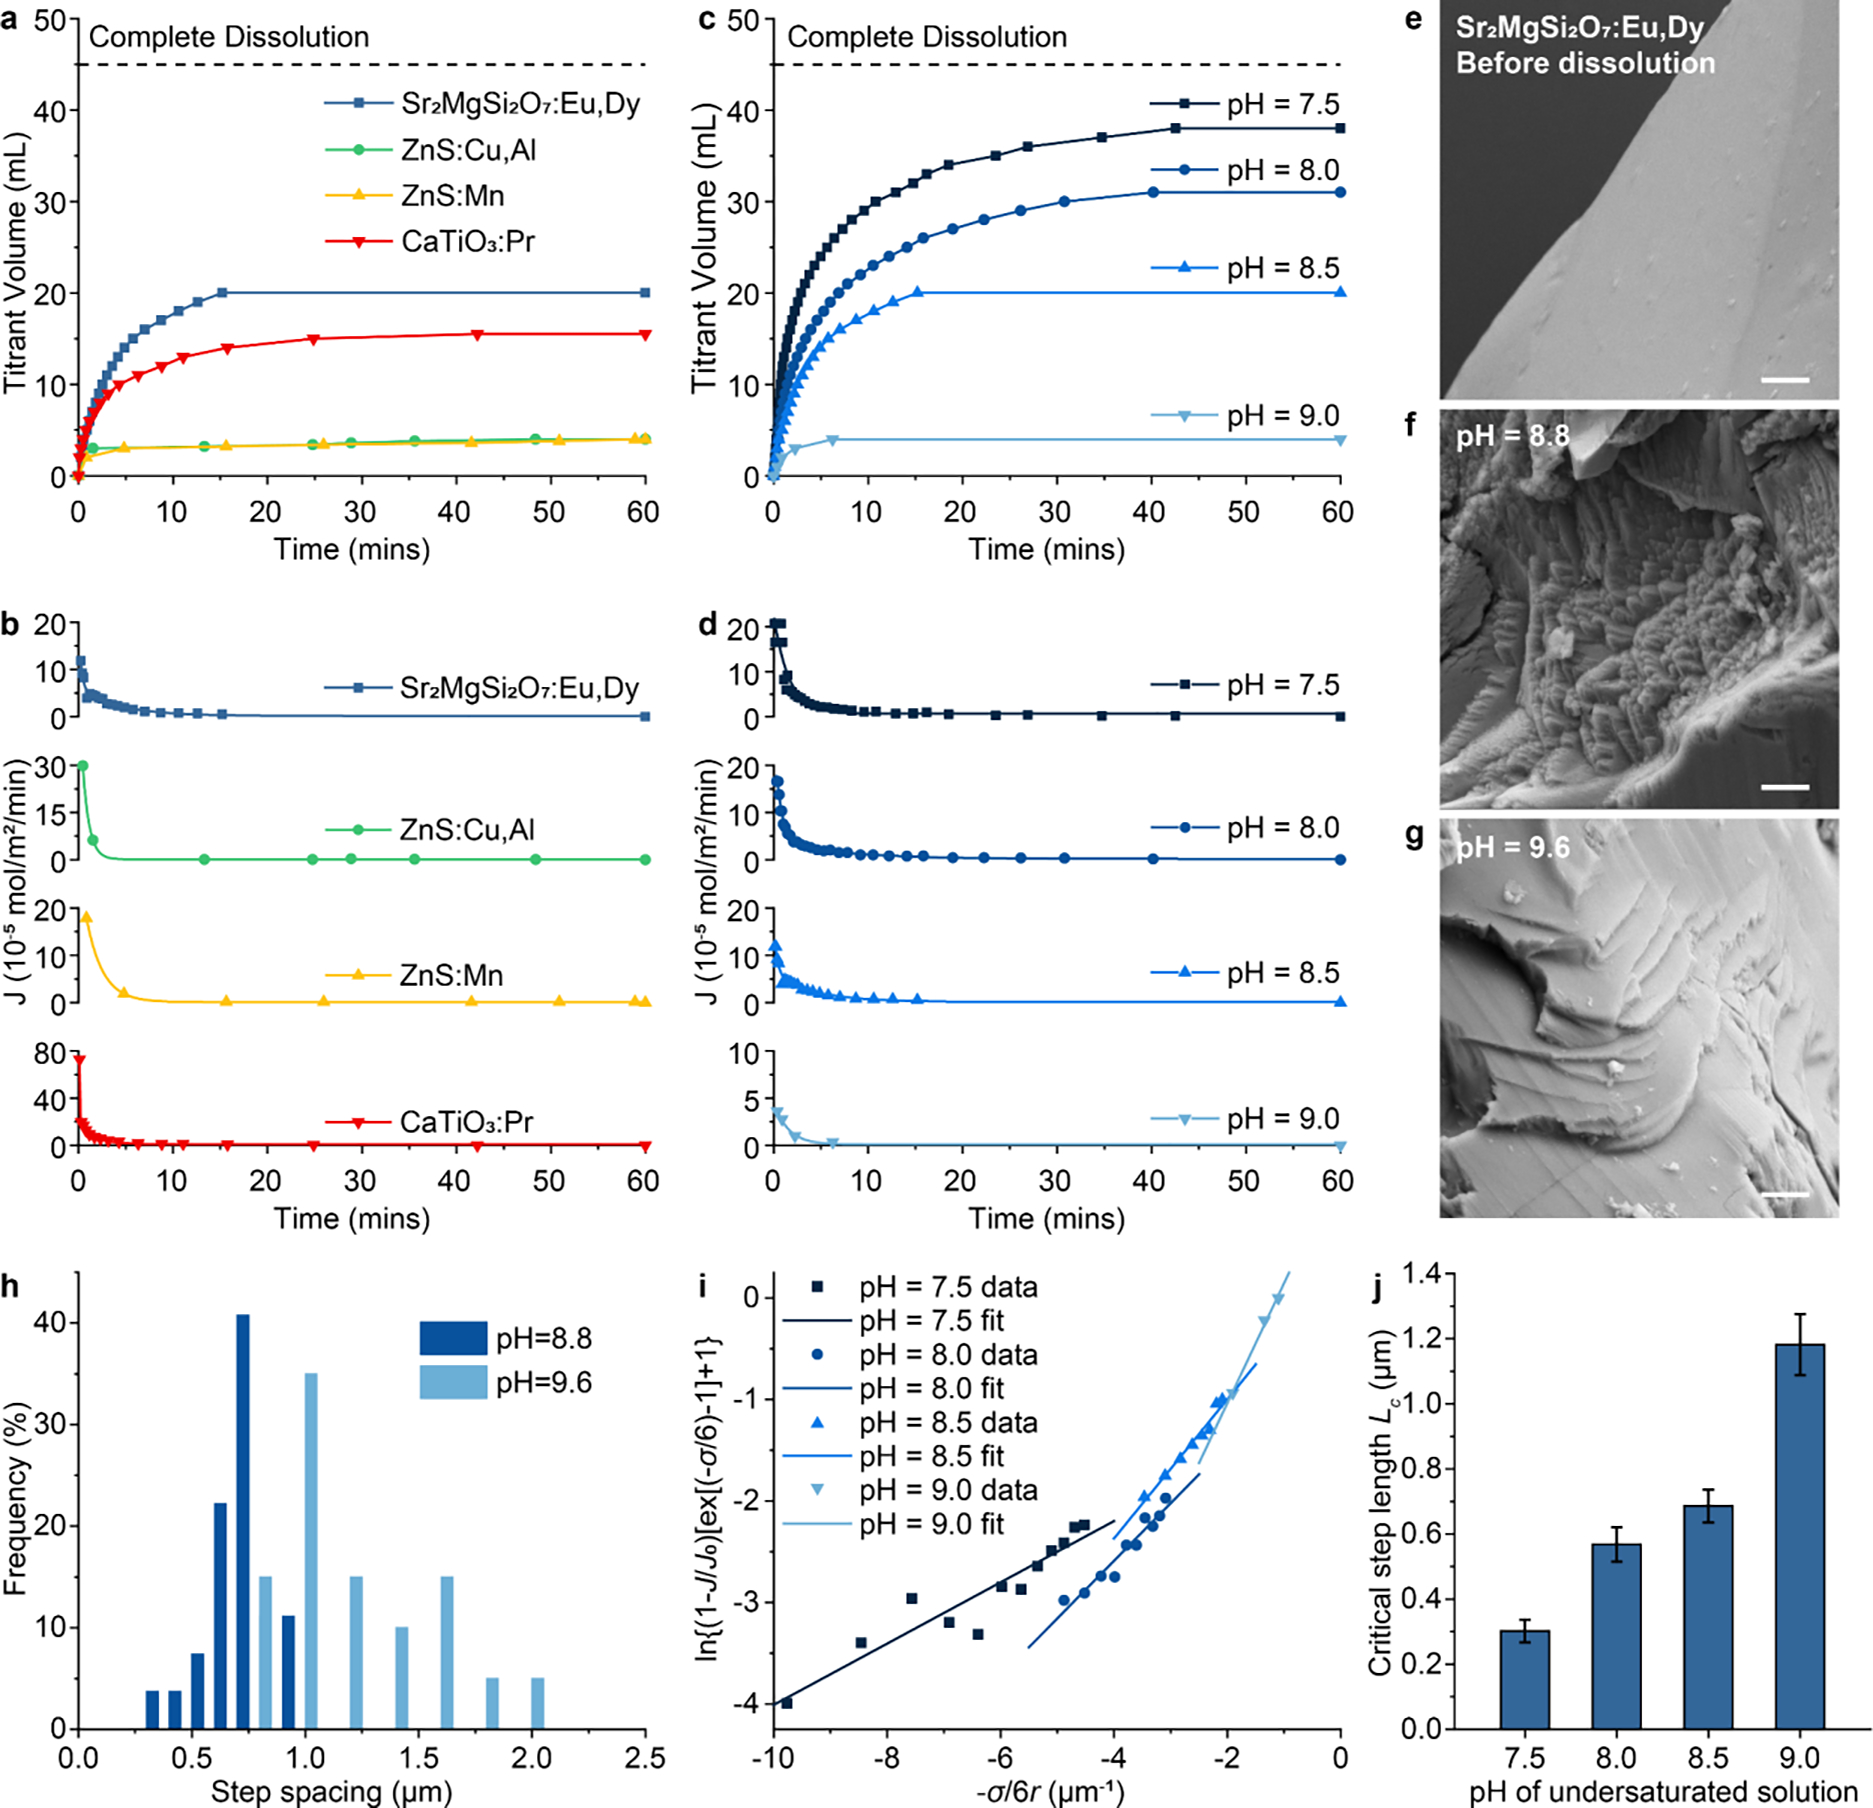
Fig. 2.

Mechanistic study of the suppressed dissolution approach in ML materials. (a&b) Titration curves (a) and dissolution flux (b) of , ZnS:Cu,Al, ZnS:Mn, and CaTiO3:Pr under constant composition (CC) conditions. (c&d) Titration curves (c) and dissolution flux (d) of at different undersaturations as determined by the of the CC solution. (e-g) SEM images of surface before dissolution (e), and after suppressed dissolution at (f) and 9.6 (g), respectively. Dissolution steps can be seen in (f&g) after suppressed dissolution. All scale bars represent 1 μm. (h) Histograms showing the step spacing distribution on the surface after suppressed solution at and 9.6 in f&g. (i) Experimental data and linear fitting of vs. under different undersaturations. (j) The critical lengths of receding steps on the surface of under different undersaturations, extracted from the slopes of linear fitting curves in (i). The error bars represent the uncertainty in fitting parameters.
