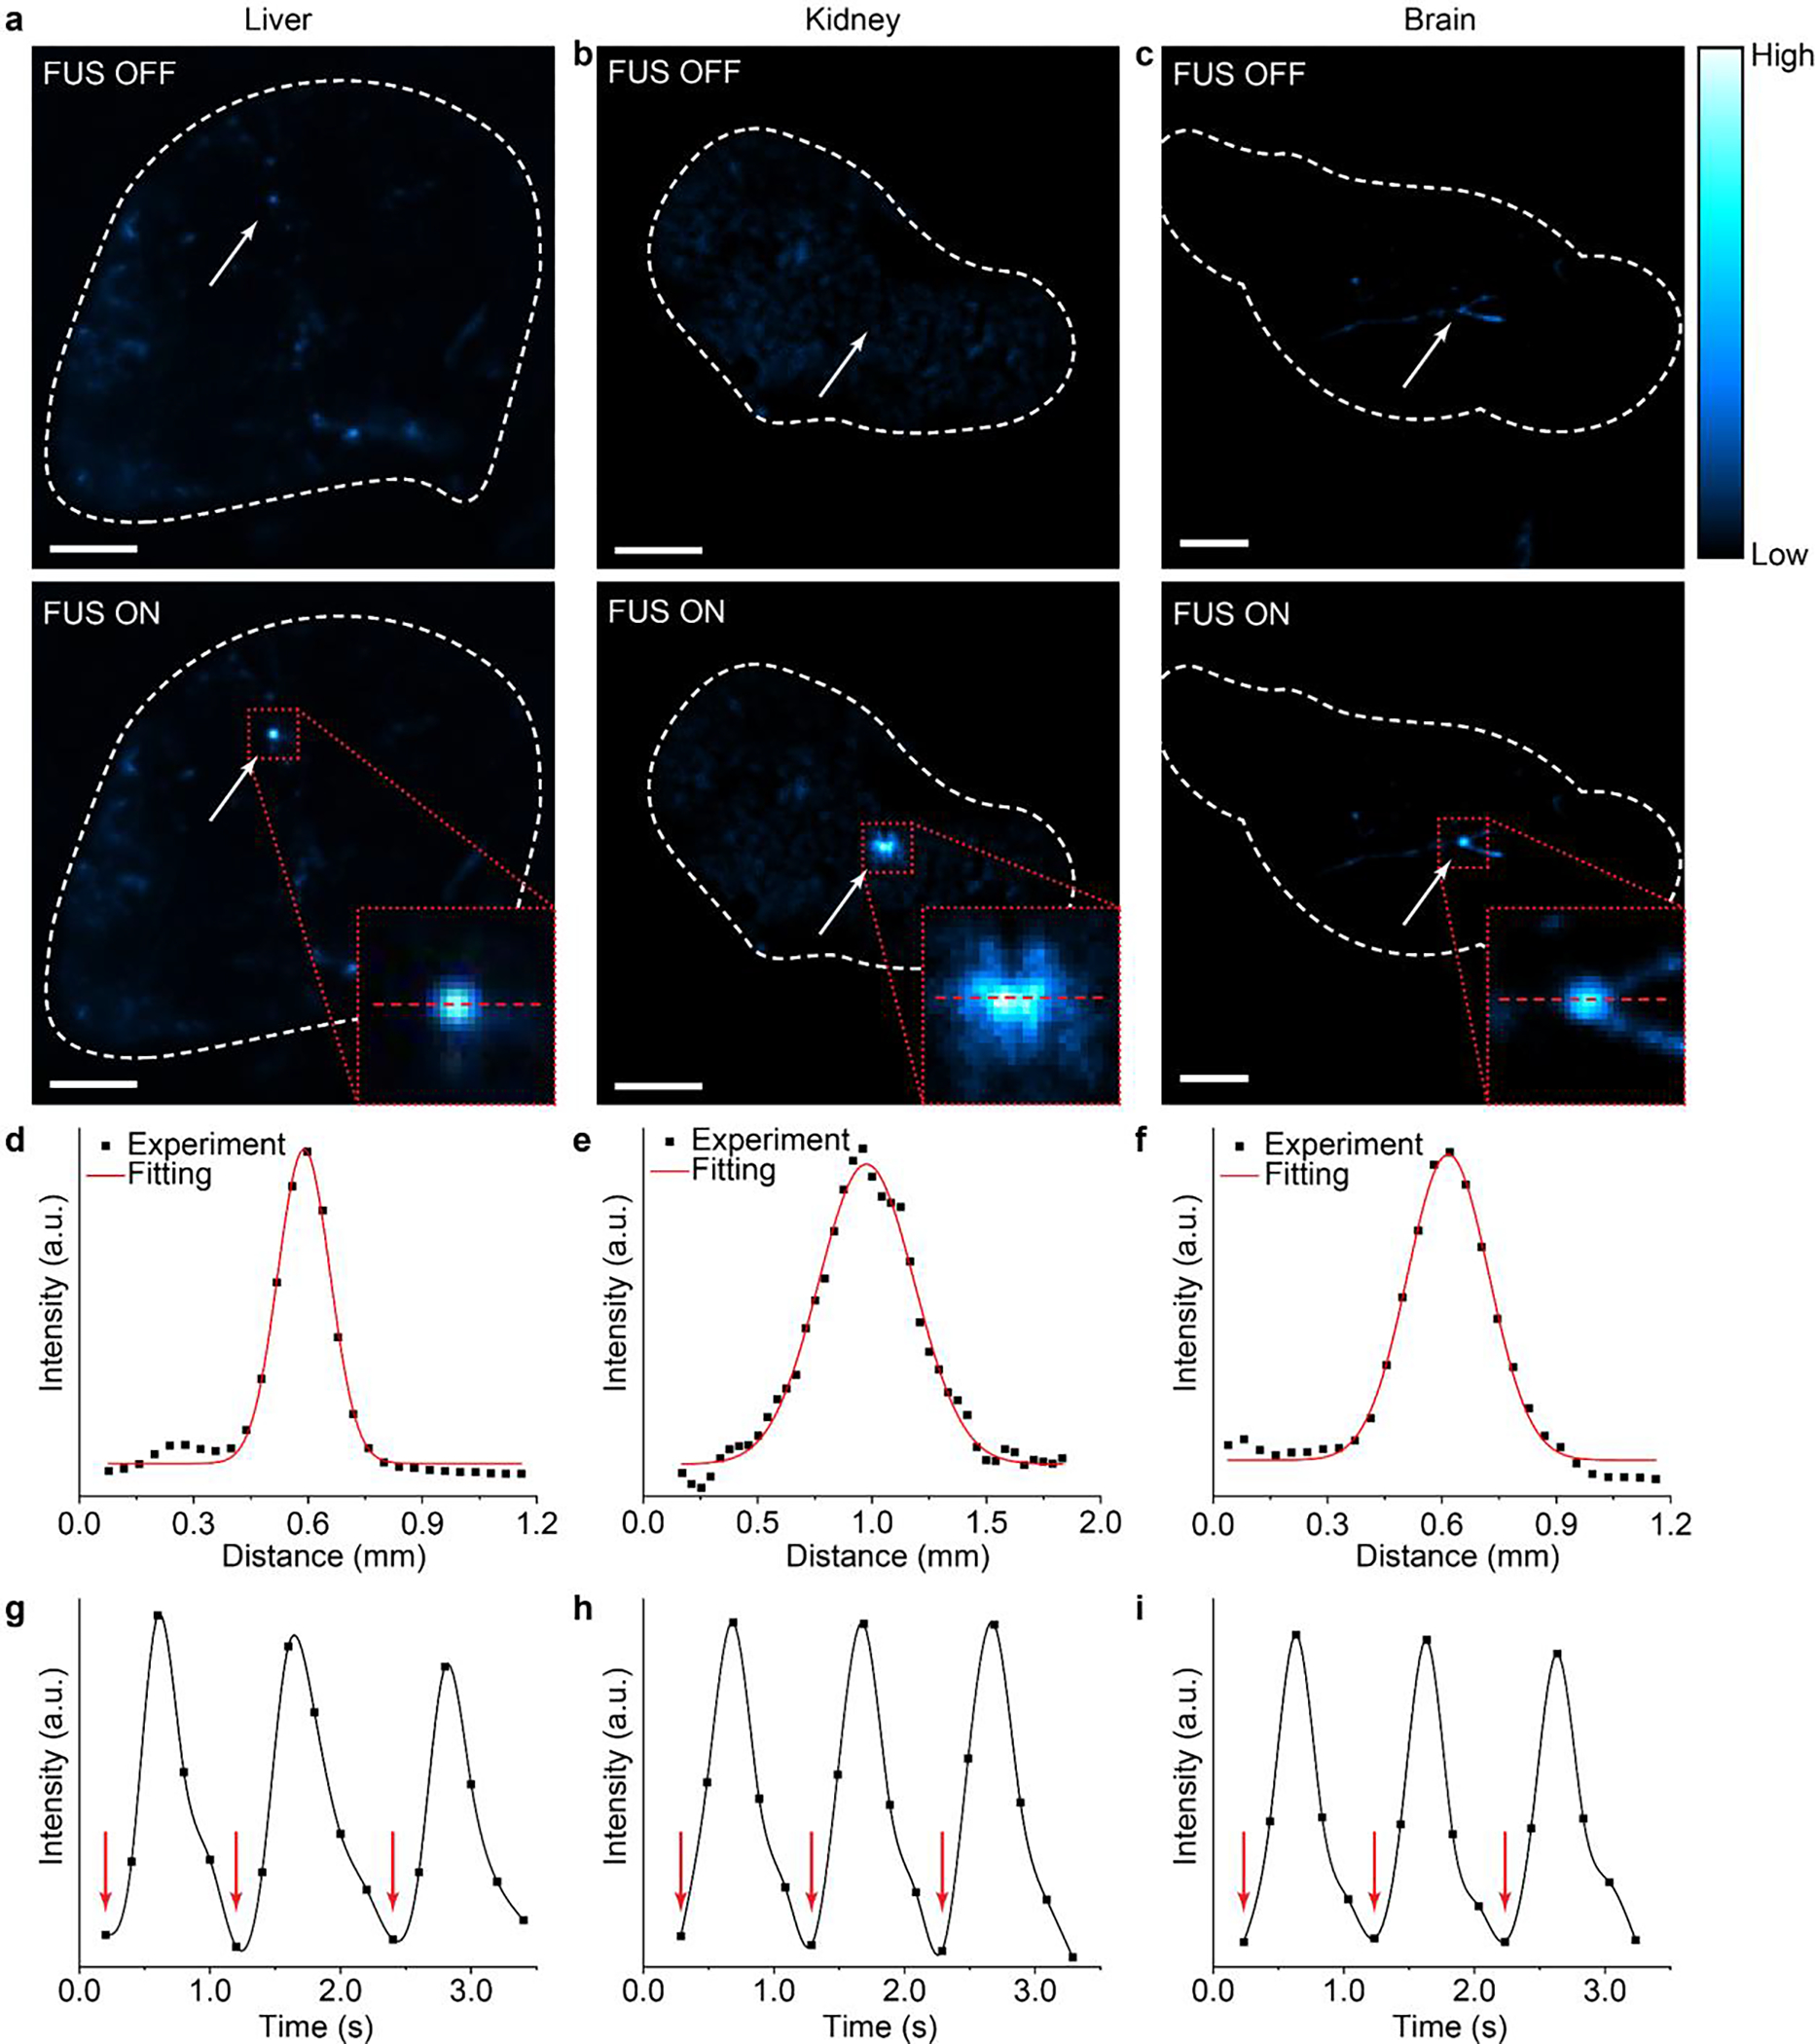
Fig. 8.

ML emission from different mouse organs. (a-c) Luminescence images of the mouse liver (a), kidney (b), and brain (c) with their vessels filled with the ML fluid of during the off (top) and on (bottom) phases of FUS pulses. All scale bars represent 2 mm. (d-f) Intensity profiles of ML emission from the liver (d), kidney (e), and brain (f) along the red dashed lines in the insets of a, b, and c, respectively. (g-i) Temporal kinetics of ML emission from the liver (g), kidney (h), and brain (i) upon repetitive FUS pulse stimulation (red arrows).
