
Figure 2.
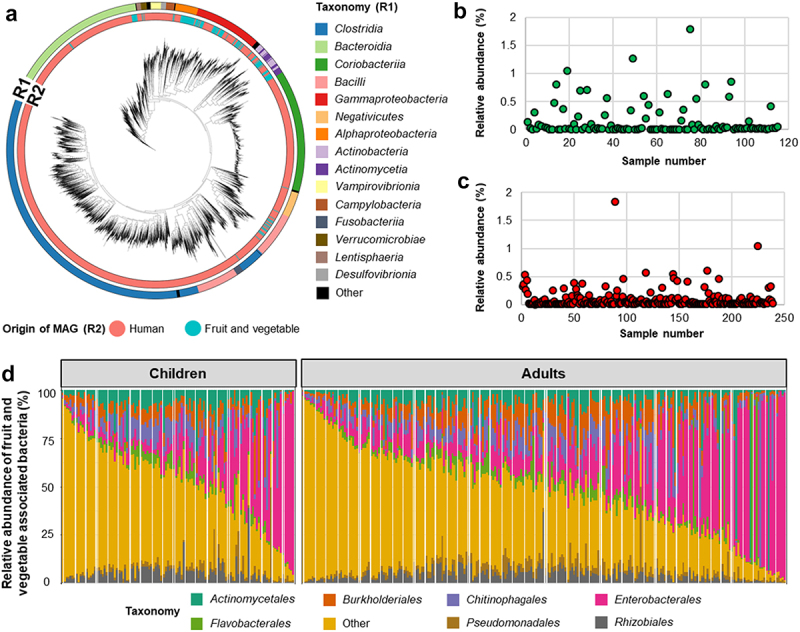
Taxonomical classification of plant and human-associated bacteria and their abundance in the human gut. Phylogenetic tree showing the taxonomical classification of fruit and vegetable and human gut-associated bacteria (a). Different colors in ring 1 (R1) indicate bacterial taxonomy and ring 2 (R2) indicates the origin of the MAGs. Relative abundance of fruit and vegetable associated bacteria and their abundance in children (b) and adults (c). Bar chart showing the relative abundance of fruit and vegetable associated bacterial composition at order level in the human gut (d). Relative abundance of fruit and vegetable associated bacteria was obtained by using datasets that contained reads that only mapped to fruit and vegetable associated bacterial genomes. Different colors represent different order-level classifications. Less abundant bacterial orders were included in “others”.