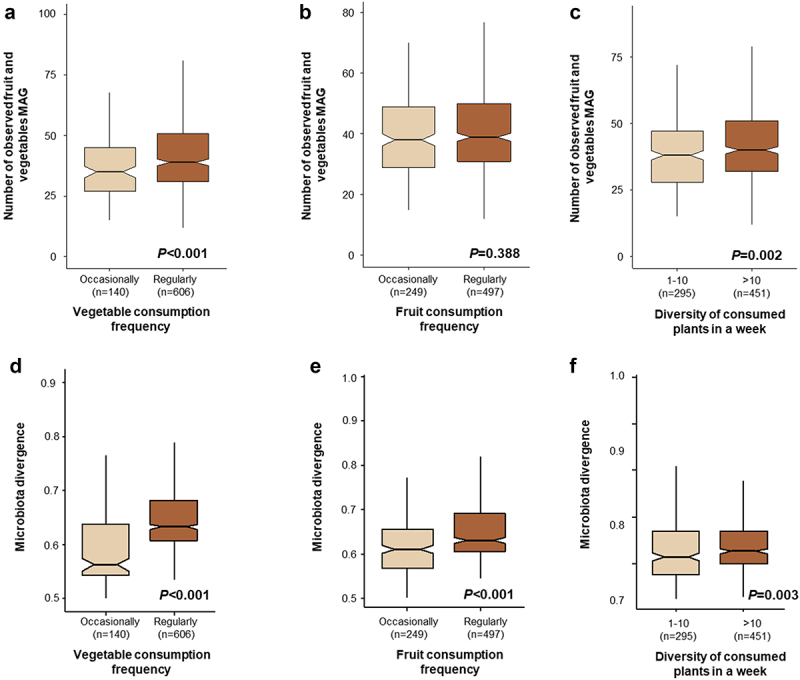
Figure 4.

Impact of vegetable consumption frequency, fruit consumption frequency, and diversity of consumed plants in a week on the number of observed fruit and vegetable associated bacteria and overall heterogeneity in fruit and vegetable bacterial community composition. The box plots show the observed fruit and vegetable associated MAGs in the gut (a-c). The additional plots show the overall heterogenicity in fruit and vegetable associated MAG composition in the gut (d-f).
