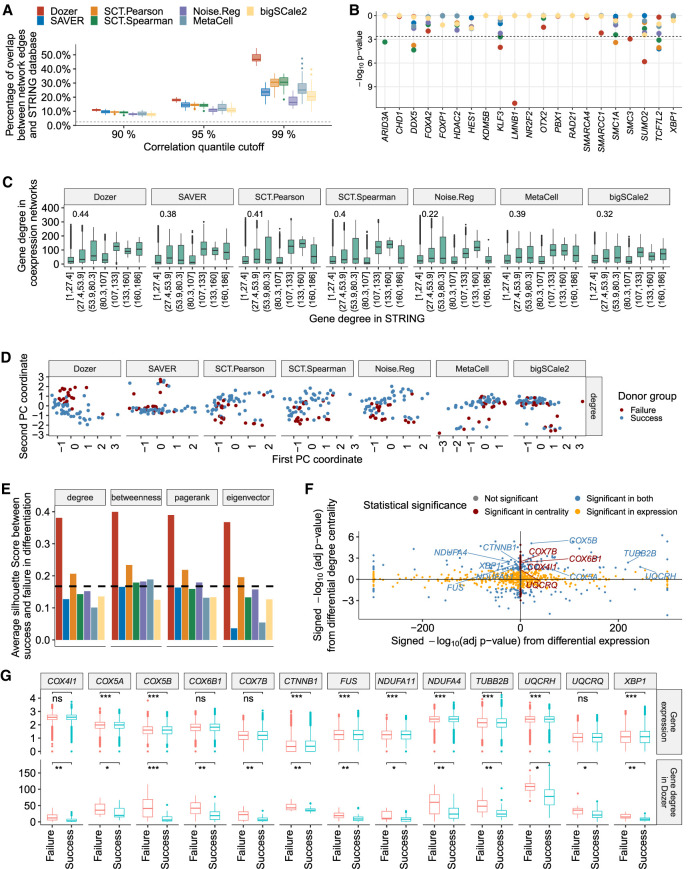
Figure 4.
Coexpression network analysis of the Jerber_2021 multiple donor scRNA-seq data. (A) The percentage of coexpression network edges validated by the STRING protein interaction database across donors. The x-axis denotes the percentile cutoff for thresholding the estimated correlations. The dashed line is the percentage of randomly selected gene pairs validated in the STRING database. The P-values from one-sided Wilcoxon rank-sum test between Dozer and the second-best method for the three percentile thresholds are 1.1 × 10⁻¹¹, 3.9 × 10⁻¹², and 4.1 × 10⁻¹², respectively. (B) Transcription factors (TFs) enriched in gene coexpression networks of the donors, evaluated using TF–target pairs documented in the hTFtarget database. (C) Comparison of estimated gene degrees from coexpression networks with gene degrees in the STRING database. (D) Visualization of donor-specific networks using the first two principal components of the network degree centralities. (E) Average silhouette scores from the first two principal components of the two groups of donors based on their gene centralities in neuronal differentiation. The dashed line represents the average silhouette score based on principal components of donors’ bulkified expression. (F) Comparison of differential degree centralities of the genes from the Dozer coexpression networks with their differential expression. The x-axis displays the signed –log10 (adjusted P-value) from differential expression with positive (negative) values denoting higher (lower) expression in the failure group. The y-axis denotes the signed –log10 (adjusted P-value) from differential degree centrality with positive (negative) values showing higher (lower) centrality in the failure group. (G) Comparison of the degree centralities from the Dozer coexpression networks and expressions of select genes associated with “neurodegeneration” across the donors in the two neuronal differentiation efficiency groups. Significance levels are coded as follows: (*) adjusted P-value < 0.05, (**) adjusted P-value < 0.01, (***) adjusted P-value < 0.001.

